Best Thread Live Cable Trading

DoubleSix said:
fseitun

what's the problem with the last 3 weeks ?

I trade trends and cant think of any special problems

The problem I have been having is related to my indicator being out of synch with the market. Before the big dollar move last Friday markets had been going sideways. The dollar upside move was so strong that it basically didnt give my indicator time to react and catch up with it.

Today the dollar trend is bullish and my indicator is finally getting in line with it. However, one of my countertrend signals is still telling me to short the dollar as it's heavily OVERBOUGHT.

One of the reasons I have been losing so many trades is likely due to the high volatility we've been having over the last 2-3 weeks. Markets were going sideways and wouldnt allow me to take medium term positions stopping me out of my trades fairly quickly.

My stop loss on the cable is 60 pips, on the EURUSD is 50 pips. I noticed that during periods of such high volatility these hard stops become very small and can be hit easily.

Just take a look at the daily bars. What kinda trend can you possibly see ? I all I can see is a sidewats market in all major crosses except for the Usd/Yen and Eur/Yen.

I dont think there is any trading system that can make money consistently in sideways markets. All systems are doomed to failure in such periods IMO; I have had a couple of winners but those were purely coincidental. There was no clear trend according to my indicator.
 
PipSqueek said:
short 7401 looking for 7275. stop and reverse at around 7435 (though that might change)


closed out for 4 pips :rolleyes: still will pay for this weekends beer :cheesy:

will try to find something to park money into to earn some interest and maybe a few pips too for the weekend. :)

take care and good weekend all.
 
badtrader's quick short yesterday @ 11:58 (10/11/05)

I just think that it would be useful for everyone if this thread was more educational - a nice reprieve from all the dreadful Socrates bashing threads :(

Maybe we could all learn faster. There have been very few genuine real-time intraday trades posted on this thread - badtrader has made several very good calls. The last one was yesterday @ 11:58.

Perhaps we could come up with some ideas as to how he is achieving these results and what he may be seeing that some may be missing. Ideally, badtrader would help with this! :)

Here's the call from badtrader @ 11:58 yesterday (10/11/05)...

nice short here but its only for 20 pips short @ 1,7486

This is a short in the face of very, very aggressive bullish activity all morning. Against a series of hourly "up" bars. How can this be a good call? What did badtrader see?

Here's my analysis...

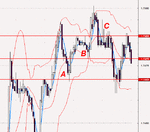
Please refer to the attached chart.

First look at the point labelled "A". How many times have you read that "support becomes resistance" (and vice versa)? It's a perfect pullback to the prior high level (469)

Now look at point "B" - same again - perfect pullback to support/resistance level @ 478.

Now look at point "C" - something's changed - the price has dropped (fast) straight through the prior (high) resistance level & not only that, the world and his wife (and badtrader :)) has realised it. Look at the very long tail(s) on the 3 minute bars and the resistance forming @ 88. What is this telling us? Looks like the "hot-money" longs are now desperate to get out.

So how did badtrader call a 20 point drop? The difference between C and A is 19 points.

This is one possible explanation.

Does anyone else have any other ideas? Other indicators, etc.? Rate decision?

Steve
 

Attachments

  • cable001.gif
    cable001.gif
    15.6 KB · Views: 207
Last edited:
c6ackp said:
I just think that it would be useful for everyone if this thread was more educational - a nice reprieve from all the dreadful Socrates bashing threads :(

Maybe we could all learn faster. There have been very few genuine real-time intraday trades posted on this thread - badtrader has made several very good calls. The last one was yesterday @ 11:58.

Perhaps we could come up with some ideas as to how he is achieving these results and what he may be seeing that some may be missing. Ideally, badtrader would help with this! :)

Here's the call from badtrader @ 11:58 yesterday (10/11/05)...


This is a short in the face of very, very aggressive bullish activity all morning. Against a series of hourly "up" bars. How can this be a good call? What did badtrader see?

Here's my analysis...

Please refer to the attached chart.

First look at the point labelled "A". How many times have you read that "support becomes resistance" (and vice versa)? It's a perfect pullback to the prior high level (469)

Now look at point "B" - same again - perfect pullback to support/resistance level @ 478.

Now look at point "C" - something's changed - the price has dropped (fast) straight through the prior (high) resistance level & not only that, the world and his wife (and badtrader :)) has realised it. Look at the very long tail(s) on the 3 minute bars and the resistance forming @ 88. What is this telling us? Looks like the "hot-money" longs are now desperate to get out.

So how did badtrader call a 20 point drop? The difference between C and A is 19 points.

This is one possible explanation.

Does anyone else have any other ideas? Other indicators, etc.? Was there any order flow or news type information to precipitate this sudden weakening (I only use charts)?

Steve


That candle between 11 & 12 resulted in a upside down cross after the 5 previous candles all being up ie the trend was up. A candle which produces a cross after a move up or down is a sign that the move is running out of steam. The next candle resulted in another cross not upside down. Which shows they tried to move the market down but failed as at the end of the bar it was almost unchanged,this is what you could call a tug of war with no winner. But their has to be winner, so this then produces volatility in the next bar where we go higher and lower than the previous 2 bars and then move down. The move down was expected but the 20 pips was a good call.

This is looking at 60mins charts

Breadman
 
Last edited:
breadman said:
That candle between 11 & 12 resulted in a upside down cross after the 5 previous candles all being up ie the trend was up. A candle which produces a cross after a move up or down is a sign that the move is running out of steam. The next candle resulted in another cross not upside down. Which shows they tried to move the market down but failed as at the end of the bar it was almost unchanged,this is what you could call a tug of war with no winner. But their has to be winner, so this then produces volatility in the next bar where we go higher and lower than the previous 2 bars and then move down. The move down was expected but the 20 pips was a good call.

Breadman
Hi Breadman,
Thanks for the above post which I found very informative.
The one thing I would add is no one knows (apart from BT himself) the time frame that Badtrader used to make the call which would as you know make a huge difference to his own analysis of the situation.

Sadly it appears that Badtrader has abandoned us in this thread and therefore perhaps it will remain a mystery.
 
JonnyT said:
Badtrader told me he uses Hourly charts.

JonnyT

ONLY hourly charts? I don't believe it. You can't trade short-term with only hourly charts.
 
Livermore said:
A stop of 70 pips..?! Why risk so much? :eek:
This is a trade long term trade and in long term trades I keep large stops.
As far as it goes for why am I going long.....
1. I think the the bull run for the Dollar is nearly over.
2.Cable has gone higher in all 4 of the the past years in the month from November to december
3.According to analyst-online everything is pointing up for the cable and we are looking at rise of 400 point in the next week to one and ahalf week..they make the calculation on daily a weekly differences.

www.analyst-online.com is the site if you are intrested.

Hope this helps
Rav
Happy trading
 
when I checked out his call on my chart I said or implied I thought he was using elliott.

the pull back for me is an abc fall to the previous 4th. a fairly common occurrrence.
his call was the "c" leg.
If that is the case, then he would need probably need an indicator (maybe 1min) to make the set-up.

Just not my time frame for trading, so I would never have made that call.
 
rav700 said:
This is a trade long term trade and in long term trades I keep large stops.
As far as it goes for why am I going long.....
1. I think the the bull run for the Dollar is nearly over.
2.Cable has gone higher in all 4 of the the past years in the month from November to december
3.According to analyst-online everything is pointing up for the cable and we are looking at rise of 400 point in the next week to one and ahalf week..they make the calculation on daily a weekly differences.

www.analyst-online.com is the site if you are intrested.

Hope this helps
Rav
Happy trading


70pips.. for me is waaaayyyyyy toooooo much. lots of data out next week.. that is not to say the direction is wrong though.
I stay away from analysts.. They are a lagging indicator. Very soon they will start encouraging people to buy dollar.. :cheesy:
 
when I checked out his call on my chart I said or implied I thought he was using elliott.

the pull back for me is an abc fall to the previous 4th. a fairly common occurrrence.
his call was the "c" leg.
If that is the case, then he would need probably need an indicator (maybe 1min) to make the set-up.

Just not my time frame for trading, so I would never have made that call.

The elliott explanation does make a lot of sense DoubleSix. The "A" leg from 500 to 485 would imply a roughly equal "C" leg of 15-20 pips (for the target), following the congested "B" section. There was a 10 pip upward spike @ 1200 which may have spooked many very short term traders taking these kinds of trades!

Whether you take the resistance approach, the impending hourly doji or the elliott analysis, all the evidence was pointing towards weakness or (at least) uncertainty following the decent run up.
 
Post # 924 very good observation 6ackp.You must have study that for a good hour. and yes you are correct well done on how I use "support becomes resistance" on you last observation at point C there was Volatility coming in to the market . and at point A I based that for my target. In fact just has the target was hit, that was a good place to go long Because the uptrend was still intact. lets go back to the first trade before I had taken the short, have a look at the hour bar just before I taken the short trade? I then zoom in to a 1min chart to see the action

But the important thing is, Can one see all this happening in real time, everything looks great after the event. That's key to successful trading act quickly what you see. because most will see it, but then go in to analysing mood,.. by doing this,you be to late. Although you would have been correct the first time you saw it.
 
Last edited:
What you think traders about posting here statements,each month for each of gbp trading strategies,then during maybe 12months period we will see with one working the best.
much better then all backtest is trading live,demo or real dosent mather just to show it works...but ofcourse post explain. of your strategy...many posts above are very good source of knowlege.

Best Regards

M
 
Further to my post . Think what you will do in five mins time, and then do it now.pre-emptive strike.
 
hmm what if you know your going long, but buy now and the price falls for 5 minutes ? to your original entry zone? is it not better to be ready 5 minutes ,well sometimes the wait is longer but to be ready and act when the price comes in?

Now badtrader on your trade that has been posted the price danced around 88 for nearly 30 mins .. at what point would or did you act short on that one ?
 
coolTrader said:
It will be nice if we just kept it short and sweet. eg I am going long. ema cross...what ever indicator pattern. No long story as I personally will just like to get to the point in an UN convoluted manner. :|


Personally, I can trade, I like the stories about what they were thinking before they made their trades. It adds something to the humaness of trading.
 
Long 1.7459.

EDIT: stop-loss = 20. target=20.
( reason: pullback on a small-timeframe upmove )
 
Top