Keep entering the trade at the wrong time?

Maybe I should learn more about Elliot Wave theory.

I'd advise against that.

Based on your description, it sounds like impatience. It's hard to say though because I might just be jumping to conclusions based on personal experience.

The best thing to do would be to video your trades - the L2,T&S, charts and your order entry - have them all on 1 screen, video it, stick it on Youtube & post the link.

Even better if you actually talk through what you are thinking at the time of taking the trade.
 
Have just completed a 500+ point week without a chart in sight.

Price Action Price Action Price Action..............

Really, do you have a statement to show for that ?

So how does this price action work without a chart ? For a retail gambler, he has nothing but the chart. So whatever you have got wouldn't work for most people.

Tell me more about your price action. Does the signal come from the gut ? I have reverted back the the gut recently for chart reading, and my results improved drastically.

I'm guessing he's referring to trading just via the dom... just a guess though.
 
I'm guessing he's referring to trading just via the dom... just a guess though.

Er no, walter (jungerns) pays a signal provider £25pcm and cleans up. He even posted a signal on a live call thread (ftse), said he disagreed with the signal, yet came back a day later to say he had made money on it and hoped others had also followed.

Jungerns' last post on this thread is possibly the most full of BS post I have ever read on this forum. The only truth in it is that charts clearly confuse walter, after all thoses jig jaggedy lines on a graph representing not only time (for most) but price as well, are so complicated.

Truly beggars belief.
 
Could easily be acheived by adding to losers etc. and not really the right direction :confused:
if craig trades frequently and using minute charts, then it would be difficult to succeed three months straight.... or at the very least, he would notice something's quite not right in his trading.
 
Have just completed a 500+ point week without a chart in sight.
Price Action Price Action Price Action..............
price action trading without a chart? ever?
how do you see and analyze price action if you do not use a chart then?
 
Er no, walter (jungerns) pays a signal provider £25pcm and cleans up. He even posted a signal on a live call thread (ftse), said he disagreed with the signal, yet came back a day later to say he had made money on it and hoped others had also followed.

Jungerns' last post on this thread is possibly the most full of BS post I have ever read on this forum. The only truth in it is that charts clearly confuse walter, after all thoses jig jaggedy lines on a graph representing not only time (for most) but price as well, are so complicated.

Truly beggars belief.
your post makes sense, his does not. he obviously left it in suspense. but I will await his reply.....
"500 point + week" indeed is cleaning up :cheesy:
 
Can you recommend a clear system?

Craig, there are lots of free systems in the forums; trade2win and others.

What's more important is that you learn a system (whichever it is); document the rules in detail, dont leave anything to guts; then backtest it for at least 2 years.

Analyst the results; focus on things like Annual profit, and max drawdown; win/loss ratio etc.

what backtesting gives you is a true understanding of your system; and how it will affect your psyche.

There are some platforms that allow you to do automated backtesting; but I do recommend you do a *manual* backtesting; so you learn about your system. Metatrader4 has a feature where you can replay the chart bar by bar; mimicking live trading. You can then record your trades in spreadsheet as you go.

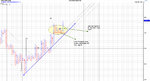
Here is a simple system; that is proven to work over decades;

Donchian Channel Breakout (aka Turtle system). It is a trend following system.

Search the net to get a detailed system rules.

hope this help.

PS; please remember that having a profitable system is the least important part of trading profitably. As I mentioned above; there are many many free profitable systems on the net. All the things that goes around it are important: money management, position sizing, maximum risk, having a plan, sticking to it, trading psychology, using low leverage, don't average down, dont follow tips, dont watch news, have a trading mentor, dont follow charlatans...etc.
 
Last edited:
Can you recommend a clear system?

Listen to Tim, P&F is the key imo.
No its not difficult, its really quite straight forward..have a look at the attached chart where the S&P went sideways for a month..
If this system isn't as clear as they come..
 

Attachments

  • S&P month of no movement P&F.jpg
    S&P month of no movement P&F.jpg
    840.2 KB · Views: 316
Quality post indeed.........

Have just completed a 500+ point week without a chart in sight.

Price Action Price Action Price Action..............

Nice joke. Without taking a look in a chart- you made 500+.
This is impossible or luck in favour with you. But still I don't believe you.
Show evidence then we may count on you........... good luck for another 500++++

:clap:
 
Thanks for all the tips.

Craig

Of course, never trade on tips. Haha - true in that you do the research of a system yourself and you know it, how it works, what it should and shouldn't do (drawdown characteristics). Solid ground. Make it programmable, objectively testable. That's the best way.

Time charts aren't all bad. Layering the timeframes is useful. And look into buying low instead of buying high - retracement patterns - or use a small size P&F relative to your 'trend chart' (your 1m), and buy double top breakouts (if you can find good charting for this). You can probably improve timing by better defining your method.
 
Hi robster,
That's not really true Tim. Time is as important as price because time and price used together can tell you whether orderflow is changing. Volume then confirms..
Apologies if I didn't make myself clear in my last post. Just to clarify, I'm not saying that time isn't important (forgive the double negative). However, for new traders, my personal view is that time can - and fequently does - muddy the waters. Trend and S&R levels are easier to see on a P&F or Renko chart than on a candlestick chart, with the added benefit that there aren't all those exciting pin bars and other such diversions to take one's focus away from the big picture. Not that there'e anything wrong with pin bars!
P&F is not useful someone trading off 1m/5m timeframes.
Interesting - why not?

Cheers,
Tim.
 
Hi Tim.

The short answer to this is that I don't think P&F gives you the richness of information you need to trade off the 1min TF (if you really do mean trading off 1m and not using 1m to time entries on higher TF).

This richness of information is required to make assessments about trade selection, entry and exit that occur over a 3-5min window with execution opportunities down in the 1-2min area.

Down on this TF it is quite noisy but the noise gives clues as to what is going on and if P&F is a mechanism to essentially iron out noise in relation to certainty (which time does as the timespan gets larger) then you are losing many of the cues that are likely to help in trade selection, entry and exit.

An example and a fairly typical set-up for me. So this is about as good as it gets for a reversal set-up but I'd be interested, purely as an experiment if you modelled this as a P&F chart and then tell me honestly whether you would have taken a reversal or passed on anything. For background:

1) It occurred at an unspecified level in relation to the market
2) Without T&S, I think there is enough information on this chart to have made the trade without T&S/DOM which I also have at my disposal.

If you think this is too much like hard work, then I'll understand also :)
 

Attachments

  • 20120905-ONL.png
    20120905-ONL.png
    86.5 KB · Views: 242
Once you realise you are dealing with someone extremely intelligent and rich on the other side, perhaps you will find a different way to play with him.

+

Good insight. Maybe a solution is to look when the other side is willing to do some charity.:)
 
but I'd be interested, purely as an experiment if you modelled this as a P&F chart and then tell me honestly whether you would have taken a reversal or passed on anything.

Hi robster,
Many thanks for the detailed explanation.

In many ways, I concur with your points. There is indeed greater detail / noise in candlestick charts and, when viewed by someone with your skills and experience, can provide important information that P&F and Renko charts don't show. Additionally, I found that P&F is pretty useless for plotting the ES, as you can't get the granularity required, unless one drops down from a 3-box reversal to a 2-box or 1-box chart. My use of P&F is both elementary and traditional - so I just stick to the 3-box! However, when I day traded the YM (I don't anymore), I used P&F to plot $Tick which worked very well, enabling me to enter when equities and futures were in concert. One could see the sentiment shifting in a very clear and visual way on the P&F chart which, IMO, was much harder to see on a standard candlestick chart.

I'm in the process of switching to a longer term swing trading approach, so I'm afraid I no longer subscribe to the wonderful InvestorRT charts which would have enabled me to provide visual examples. Sorry!

To conclude, I hear what you're saying and, to a greater or lesser extent, I agree with your comments. However, in certain applications, non time based charts are a real boon. Just from a screen real estate perspective, they generally contain much more history than a candlestick chart, which in itself is often a real asset.
Tim.
 
you are trading retail prices instead of wholesale prices

can someone explain what this means? I tried goggling wholesale stock pricing but the first hits are either about costco or general wholesale (and are not investment related), is retail and wholesale pricing in this for currency pricing and not security prices?
 
Last edited:
can someone explain what this means? I tried goggling wholesale stock pricing but the first hits are either about costco or general wholesale (and are not investment related), is retail and wholesale pricing in this for currency pricing and not security prices?

There is a saying in the professional trading community - buy wholesale and sell retail. Conceptually the idea is to buy where the big boys are accumulating and sell where retail is buying. In its most simplistic form is to buy retracement and sell rallies. The big boys supposedly don't chase prices but will work the market to get wholesale prices. It means they will sell to grab from weak longs.
 
Top