ChattiFX
Member
- Messages
- 66
- Likes
- 4
Hi, from a thread I started about general trend direction I revisited how I assess the overall trend direction.
Although not a fully formed plan I've started using Kaufman Adaptive Moving Averages and S/R. I just thought I would share a couple of charts and I'd be interested in any opinions as there doesn't seem to be much on KAMA on here.
Essentially I am using a 4 hour chart to assess direction and then a 5 min chart for signals. I was using TMA's for the 4 hour direction but as with all MA's sideways and "the bend at the end" are an issue. KAMA & S/R seem to give me a better idea of when the trend is going sideways which is when most of my loses occur. I'm looking more at the gradient and bandwidth of the KAMA and 2xStd bands rather than the which side of the KAMA the price is.
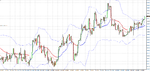
See below charts. the paler blue/red dots are a 5 period KAMA and the darker ones are 20, with 2xStD Bands in blue. The longer KAMA is the one I am mostly basing my decision on with the shorter KAMA as almost a pre-signal...
EUR/GBP - Long
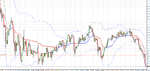
AUD/JPY - Short
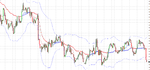
AUD/USD - Just breaking out of a sideways movement. This pair has been a bit of a killer using TMA as it crossed back and forth. KAMA and bands gives quite a nice picture as to why.
I'm still learning how to interpret the indicators properly but I am happy with the way I am getting on so far.
Hope this is of interest to a few and all opinions welcome 🙂
Cheers,
CFX
Although not a fully formed plan I've started using Kaufman Adaptive Moving Averages and S/R. I just thought I would share a couple of charts and I'd be interested in any opinions as there doesn't seem to be much on KAMA on here.
Essentially I am using a 4 hour chart to assess direction and then a 5 min chart for signals. I was using TMA's for the 4 hour direction but as with all MA's sideways and "the bend at the end" are an issue. KAMA & S/R seem to give me a better idea of when the trend is going sideways which is when most of my loses occur. I'm looking more at the gradient and bandwidth of the KAMA and 2xStd bands rather than the which side of the KAMA the price is.
See below charts. the paler blue/red dots are a 5 period KAMA and the darker ones are 20, with 2xStD Bands in blue. The longer KAMA is the one I am mostly basing my decision on with the shorter KAMA as almost a pre-signal...
EUR/GBP - Long
AUD/JPY - Short
AUD/USD - Just breaking out of a sideways movement. This pair has been a bit of a killer using TMA as it crossed back and forth. KAMA and bands gives quite a nice picture as to why.
I'm still learning how to interpret the indicators properly but I am happy with the way I am getting on so far.
Hope this is of interest to a few and all opinions welcome 🙂
Cheers,
CFX