journal of trader formally known as wasp

Status
Not open for further replies.
Cheers db,

Like you say, I could define it using backtests but I'd rather stick with slowly doing it forward as that way its true, not an old chart with hindsight, regardless of how definable the setups are...

I'll take a look at the other calculations later on...
 
Unfortunately, determining your longest uninterrupted string of losers through real-time trading can be hard on the nerves. But they're your nerves :)
 
dbphoenix said:
Unfortunately, determining your longest uninterrupted string of losers through real-time trading can be hard on the nerves. But they're your nerves :)

Thats the problem though, as much as I would like to say 'my system in the last three years only had a string of 6 losses at worst', in real time things can work out differently. Whether they should or not!
 
Yes, they can. But if you've defined and tested and traded your setup properly, at least you'll know that something is wrong if you have a string of more than 6 losses.

But, again, it's your choice.

Db
 
dbphoenix said:
Yes, they can. But if you've defined and tested and traded your setup properly, at least you'll know that something is wrong if you have a string of more than 6 losses.

But, again, it's your choice.

Db


Yep, and its usually me! Although I may not have a figure on W:L or P:L or a number for the worst string of losses I may encounter, I do know it will make more than I lose as my stops are always small (but not too small), I know cables good runs are always over 80-100 pips and they happen at least twice a week, and by sticking to a max number of trades a day minimizes overtrading and bad runs.

The real issue is me trading the plan and by having it here for all to see I am getting more disciplined as despite the wonderous (backtest) figures on paper, until I am pulling off the same trades in real time, those figures mean zilch.

I have run the backtest figures through various excel examples and it always come out trumps so I'm not fearful in that department, I know I can make profits, as long as I can do what I am meant to, and no manner of %'s will help me till I am doing it, in real time.

(Which, at the moment I am doing pretty well thankfully)
 
Last edited:
ericsson

update.

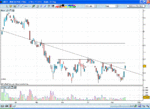
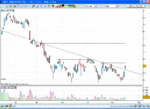
Moved stop to breakeven. Looking to see if we break north from here and the down trendline will hold. Volumes slightly higher each of the last three days.
 

Attachments

  • ERICB.GIF
    ERICB.GIF
    36.8 KB · Views: 234
DB, I always look forward to reading how you're helping wasp. Can I ask if you're a pure stocks and shares player or do you dabble with fx too ? You're obvioulsy very knowledgeable.

cheers
 
Stats

Limited data but up till now all per journal (a whole 7 days!)...

7 days
32 trades

16 wins
16 losses

353 pips

50% W:L ratio

worst run of losses > 3
best run of winners > 7

average loss > 11
average win > 31

average daily pips > 50

I'll update this each weekend to coincide properly for each week and entire period so as more data comes available, more density can be put into the figures.
 
wasp said:
Yep, and its usually me! Although I may not have a figure on W:L or P:L or a number for the worst string of losses I may encounter, I do know it will make more than I lose as my stops are always small (but not too small), I know cables good runs are always over 80-100 pips and they happen at least twice a week, and by sticking to a max number of trades a day minimizes overtrading and bad runs.

The real issue is me trading the plan and by having it here for all to see I am getting more disciplined as despite the wonderous (backtest) figures on paper, until I am pulling off the same trades in real time, those figures mean zilch.

I have run the backtest figures through various excel examples and it always come out trumps so I'm not fearful in that department, I know I can make profits, as long as I can do what I am meant to, and no manner of %'s will help me till I am doing it, in real time.

(Which, at the moment I am doing pretty well thankfully)

And I'm glad that you're finding success in sticking to your plan. And I don't want to rain on your parade. Just keep in mind that you will run into losses regardless of how religiously you trade your plan. When that happens, have some contingency in place for dealing with it rather than succumb to the temptation to depart from your plan.

Success can sometimes be as effective a means of sabotage as failure.

Db
 
Priceman said:
DB, I always look forward to reading how you're helping wasp. Can I ask if you're a pure stocks and shares player or do you dabble with fx too ? You're obvioulsy very knowledgeable.

cheers

Actually, I've been trying to stay out of it. And I don't know how much help it is since wasp seems to be doing just fine. But I'm impressed with the fact that he's doing the work rather than just talking about it. (And I don't mean to talk about wasp as if he weren't here . . . )

I switched to index futures in '00.

Db
 
wasp;

hope you dont mind me butting in here, on your journal. :)

it may be useful to know what your figures would look like if you removed the best 5% of trades. ( 1 in 20 )
does it adversely affect your percentages?
reason for this is, every now and then, a windfall run takes place that you catch, and that really helps.
but, what if theose windfalls didnt happen as often, or you were on holiday ?

following on from DBs post about strings-of-losses, this idea may give you an idea of what a really low-volatile and rangey market may do to your account.

I have started to do this with my own trading, just so I dont get blase, and have unrealistic expectations.
I treat my best 5% of trades as "lucky", and remove them from my W:L ratios.

hope that helps.
 
trendie said:
wasp;

hope you dont mind me butting in here, on your journal. :)

it may be useful to know what your figures would look like if you removed the best 5% of trades. ( 1 in 20 )
does it adversely affect your percentages?
reason for this is, every now and then, a windfall run takes place that you catch, and that really helps.
but, what if theose windfalls didnt happen as often, or you were on holiday ?

following on from DBs post about strings-of-losses, this idea may give you an idea of what a really low-volatile and rangey market may do to your account.

I have started to do this with my own trading, just so I dont get blase, and have unrealistic expectations.
I treat my best 5% of trades as "lucky", and remove them from my W:L ratios.

hope that helps.


I see exactly what your saying Trendie and if I removed the best 5% I would drop down to probably 30% and overall net loser.

Alternatively, for the sake of horrid days I will not trade more than 5 trades in one day... this then means cable would have to run for at least a week virtually flat in order to make a real problem.

You are an FX trader (or were last time I looked :eek:) and we know that weeks of really dire conditions aren't that common, esp. in cable. As for labelling them lucky, I wouldn't say so, if I don't catch the best moves of the day it could only be my own fault and similarly, if I was away, I'd not be about to catch the crap either. Even today was only a minor blimp as I knew I'd be back ready for the CPI figures.

I don't think you can regard today and yesterdays moves as rare, or windfalls. Take a look back over '06 alone and two thirds of the days have at least a possible 50 point move if not (sometimes alot) more and my strat is aimed at catching those rather than the smaller moves.

The couple of good moves each week are integral to the plan and if I started missing them, or they stopped appearing yes, I would be in trouble, but thats why I stick to below 1% risk per trade to not worry about these situations.
 
Barjon,

Seeing as you joined me in the WHN? Ericsson trade, I'd like to hear your views on it now?
 
same thing but different

Not the reason I picked the stock at all but just noticed how they are both very similar. Obviously cable has moved on a bit...
 

Attachments

  • ERICB.GIF
    ERICB.GIF
    36.8 KB · Views: 232
  • cable.gif
    cable.gif
    29.4 KB · Views: 235
wasp said:
Barjon,

Seeing as you joined me in the WHN? Ericsson trade, I'd like to hear your views on it now?

wasp

mmm, back in that choppy area and nearing the intermediate resistance you drew in. Another gap open to the upside wouldn't surprise and if it tried to poke higher from there I'd be tempted to exit if it then fell back below the open. Otherwise stop around 2.45 and wait and see?

good trading

jon
 
confidence level

wasp, hope you don't mind me putting this up here but as you were busy doing the calculus, perhaps you'd be interested in finding your confidence level. Which actually gives a good indication whether are not your system is prepared for losing streaks and has balanced the more extreme wins which could influence your profit:loss otherwise.

Basically, it's what these two gentlemen said:

trendie said:
it may be useful to know what your figures would look like if you removed the best 5% of trades. does it adversely affect your percentages?

dbphoenix said:
In addition, you should determine your maximum single loss and your longest uninterrupted string of losing trades.

Take x = ABS (Average Profit) * (Number of Trades)^0.5 / (STDev of Profits)
Standard deviation can be easliy calculated using Excel or any other spreadsheet. The larger your stdev, the lesser confidence level. A consistently profitable strategy would also have a fairly consistent target or loss with the occasional drawdown or "lucky big bucks" imho. Like trendie says, removing the best 5% or like dbphoenix says, determining the maximum loss, both are in a way part of this equation.

The average profit can be negative, but in your case it doesn't appear to be the case :)

0 -> 50%
0.126 ->55%
0.25 ->60%
0.52 ->70%
0.67 ->75%
0.84 ->80%
1.04 ->85%
1.28 ->90%
1.645 ->95%
2.05 -> 98%
3.0 ->-- 99%
 
Actually, what I said has nothing to do with standard deviations or levels of confidence.

Keep it simple.

Db
 
dbphoenix said:
Yes, they can. But if you've defined and tested and traded your setup properly, at least you'll know that something is wrong if you have a string of more than 6 losses.

But, again, it's your choice.

Db

What would the possible scenarios be then, if one were to encounter another similar losing streak?
 
dbphoenix said:
Actually, what I said has nothing to do with standard deviations or levels of confidence.

Keep it simple.

Db

It was only a suggestion of a basic scientific principle, I apologize if you find me quoting you inappropriate. Nevertheless, determining the maximum loss over a time period has a lot to do with looking at the distribution of your results.
 
firewalker99 said:
wasp, hope you don't mind me putting this up here but as you were busy doing the calculus, perhaps you'd be interested in finding your confidence level. Which actually gives a good indication whether are not your system is prepared for losing streaks and has balanced the more extreme wins which could influence your profit:loss otherwise.

Basically, it's what these two gentlemen said:


Take x = ABS (Average Profit) * (Number of Trades)^0.5 / (STDev of Profits)
Standard deviation can be easliy calculated using Excel or any other spreadsheet. The larger your stdev, the lesser confidence level. A consistently profitable strategy would also have a fairly consistent target or loss with the occasional drawdown or "lucky big bucks" imho. Like trendie says, removing the best 5% or like dbphoenix says, determining the maximum loss, both are in a way part of this equation.

The average profit can be negative, but in your case it doesn't appear to be the case :)

0 -> 50%
0.126 ->55%
0.25 ->60%
0.52 ->70%
0.67 ->75%
0.84 ->80%
1.04 ->85%
1.28 ->90%
1.645 ->95%
2.05 -> 98%
3.0 ->-- 99%

Good stuff, and if it helps you, use it, for me, I am confident in my plan and its just a case of discipline rather than stats, I just included them to see what they worked out at.

dbphoenix said:
Actually, what I said has nothing to do with standard deviations or levels of confidence.

Keep it simple.

Db

Not really interested in standard deviations but the confidence part is important. How you reach your levels of confidence, be it %'s, backtests, forward tests or live trading, aquiring a level of confidence is vital to be able to pull the trigger and stay in a trade until your strat tells you to exit.

This is why I started the journal originally because I was panic exiting as I had no faith in my plan. Its not until I started this and said to myself that I have to trust it and then started producing the results I should be that my confidence levels grew. This is just my way of doing this and building faith.

firewalker99 said:
What would the possible scenarios be then, if one were to encounter another similar losing streak?

Like I have said to you before, I personally limit my daily trades to account for the flat choppy days. This usually means I am done by midday and then I walk away. The only exception being NFP and FOMC days when I am sometimes inclined to wait.

What you do need to do is once you have decided on your business/trading plan is test every possible scenario until you find the best/most profitable way for you. I tried various strats to limit the bad days and the bad runs and lots of backtests and figures and excel calculations this worked best for my risk reductions and overall goals.

firewalker99 said:
It was only a suggestion of a basic scientific principle, I apologize if you find me quoting you inappropriate. Nevertheless, determining the maximum loss over a time period has a lot to do with looking at the distribution of your results.

I agree this calculations can help. Once you have decided on your strategy, you can then work these out and decide wether it suits you. I personally have numerous calculations via different means and have the black and white proof I can profit from my plan and its mainly excel related but again, this is just me.


firewalker99 said:
I'm not looking for ALL of the answers, I was merely trying to figure out what could be possible starting points. I'm not expecting to be told what to do, but as someone adviced me to go to T2W to look for advice, I was hoping to get back on track in the right direction. Honestly, when I read some comments to novices (like myself) in the likes of "just study the market", "just look and observe and feel the flow", "forget about everything you've learned",... I begin to understand why people spend so much money on books and trading courses, they are left over to finding it out all by themselves. And although some people are perhaps able to succeed without any help, I believe most of us do need something to get a grasp on.

I do get agitated when more experienced traders call those novices "lazy" because there not willing to spend hours swimming in the worldwide ocean without having a clue what to look for. Seems like looking for a needle in a haystack for most. Personally, I've started off the wrong foot, I'd be the first to acknowledge that I've never should have started trading without a tested plan and I've be punished for that in more ways that only financially.

On the other hand, I've been looking at realtime charts without trading for 10hours a day, for over months now. Dozens of books, articles, interviews... some harder to digest than others. And then when you're trying to make something useful of it, you're mixing it all up exactly because the overload of information. People tell you to forget of all that and start from scratch all over. I'm still continuining in my efforts, but I wonder at what point they may seem in vain, if it results in nothing more than wandering around in circles. But perhaps that too is a process we must go through, although I'm certain others have found better ways [with better I'm not implying faster].

Having read a lot of posts from the First Steps, the following sounds all too familiar :|


...there are many new members on T2W and many of those will be new to trading as well. ... I was merely enquiring on behalf of newbies how experienced members might go about the process of learning how to trade. To say things like "but what you really want is to be told what to do" is offensive... To say "what's required is not "attitude" but the willingness to do the work" implies that I am lazy, which I don't believe I am.... if you really wanted to learn how to trade, then you'd be learning how to trade". How on earth does such a banal comment help a novice trader?


firewalker99 said:
So why do the not-so-novice traders on this forum who have the experience and knowledge, refrain from posting (just a thought) a simple practical example: a chart of the previous day with realtime trades, where and why they took an entry, where and why they exited the trade, why they have fixed or variable targets, what they do if the trade doesn't seem to go in the right direction, and so forth. Apart from wasps journal (who uses MA crossovers), I still have to look at the first PV with that kind of annotations made in realtime, not a hindsight analysis. I think this would encourage others to do the same, but instead newbies are fired with questions like "what is your trading plan? describe your setup in detail? what kind of testing did you use? why would you enter there, what is your target" which they are unable to resolve, exactly because they are still in the process of figuring that all out. The participant's perspectives are clouded while the bystander's views are clear.

That reminds me of a Chinese proverb:
“Tell me and I'll forget; show me and I may remember; involve me and I'll understand.”

Mate,

I can tell your getting really agitated as you seem to be getting nowhere fast! DON'T PANIC! said Ford Prefect to Arthur Dent...

No one said it'd be easier and there are plenty of options to base a plan around....

Indicators
Breakouts
S/R
News
1-2-3 reversals
Ross hooks
HrH and HrL's

the list is endless... Most would say newbies are lazy due to the number of threads relating to how they got duped by online 'get rich FX systems etc' and most, if not all, spent months and years learning the markets and trying various things to reach where they are now...

You have to find these things for yourself. Only you know whats best for you and once decided you can then calculate the best stats for your bank balance.

I'll offer my limited knowledge to help you out but as you may have noticed, the most common word in all this post is YOU. This isn't a fob off but at the end of the day, only you know all the details which will fit you...

hours in a day
personal commitments
risk tolerance
profit targets
swing or scalp
etc......
 
Status
Not open for further replies.
Top