You are using an out of date browser. It may not display this or other websites correctly.
You should upgrade or use an alternative browser.
You should upgrade or use an alternative browser.
- Status
- Not open for further replies.
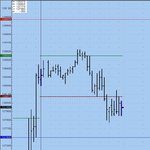
August 6th Trade 2 + End of Day
Trade 2: Selling Weekly R1 (1289.75)
Sold at 1289.25
Stop at 1292.25
Exit at 1289.25
Gross p/l = 0
Got close to the target of 1285.25, but closed at breakeven at 15.00pm (I don't trade the last 15-minute bar)
Total for the day: +3.50 + 0.00 = +3.50
Trade 2: Selling Weekly R1 (1289.75)
Sold at 1289.25
Stop at 1292.25
Exit at 1289.25
Gross p/l = 0
Got close to the target of 1285.25, but closed at breakeven at 15.00pm (I don't trade the last 15-minute bar)
Total for the day: +3.50 + 0.00 = +3.50
Levels for use 7th August
1377.58 (Weekly R3)
1343.25 (Resistance)
1328.75 (Resistance)
1319.08 (Weekly R2)
1316.75 (Resistance)
1300.50 (Resistance)
1289.67 (Weekly R1)
1284.92 (Daily Pivot Point)
1275.50 (Support)
1260.58 (Weekly Pivot Point)
1231.17 (Weekly S1)
1202.08 (Weekly S2)
1143.58 (Weekly S3)
1377.58 (Weekly R3)
1343.25 (Resistance)
1328.75 (Resistance)
1319.08 (Weekly R2)
1316.75 (Resistance)
1300.50 (Resistance)
1289.67 (Weekly R1)
1284.92 (Daily Pivot Point)
1275.50 (Support)
1260.58 (Weekly Pivot Point)
1231.17 (Weekly S1)
1202.08 (Weekly S2)
1143.58 (Weekly S3)
Numbers for use August 8th
Today sees the reintroduction of the Daily Point of Control into the levels list.
1377.58 (Weekly R3)
1343.25 (Resistance)
1328.75 (Resistance)
1319.08 (Weekly R2)
1316.75 (Resistance)
1300.50 (Resistance)
1289.67 (Weekly R1)
1278.75 (Daily Point of Control)
1273.50 (Daily Pivot Point)
1260.58 (Weekly Pivot Point)
1231.17 (Weekly S1)
1202.08 (Weekly S2)
1143.58 (Weekly S3)
Trade 1 + End of Day
Daily Point of Control (1278.75)
Sold at 1278.00
Stop at 1281.25
Exit at 1281.25
Gross p/l = -3.25
Not a good result with the reintroduction of the Daily Point of Control, however it did indirectly bring home the importance of not cutting short the winners.
Despite this failing today, I should now be at a stage where I'll average 5 trades a week, which is my first priority. I think it's easier to commit capital to a trade if the chances are it will be the only trade of the day.
Results so far + thoughts
I thought it would be worthwhile looking at the p/l so far, and put down some thoughts.
Week ending July 11th: +2.75
July 18th: +1.75
July 25th: -7.00
August 2nd: +1.75
August 9th: +0.25
Hidden within those results has been an upward trend in the size of the winners, but a decrease in the frequency of trading as I've trimmed the least effective strategies.
What has surprised me, and is only really noticeable through writing this journal, is how much the plan has changed. This is partly through learning from others, but also shows the lack of confidence I had in some of the setups (e.g the single print trades).
The entry strategies I now have are:
(1) Weekly Pivot Points
(2) Daily Pivot Point
(3) Daily Point of Control
(4) Historical Market Profile "New Beginnings"
I'm still using a short-only strategy, however I have dispensed with limit orders and instead use market orders and stops.
Stops and targets are mainly being driven by current market volatility. This should reduce the need to get too obsessed with a trailing methodology, but also calls for a more aggressive attitude.
Last edited:
Weekly Pivot Points
Weekly Pivot Points are as follows:
Weekly High = 1298.00
Weekly Low = 1246.25
Weekly Close = 1292.25
Weekly Pivot Point = 1278.83, Weekly Range = 51.75
WR3 = 1382.33
WR2 = 1330.58
WR1 = 1311.42
WPP = 1278.83
WS1 = 1259.67
WS2 = 1227.08
WS3 = 1175.33
Weekly Pivot Points are as follows:
Weekly High = 1298.00
Weekly Low = 1246.25
Weekly Close = 1292.25
Weekly Pivot Point = 1278.83, Weekly Range = 51.75
WR3 = 1382.33
WR2 = 1330.58
WR1 = 1311.42
WPP = 1278.83
WS1 = 1259.67
WS2 = 1227.08
WS3 = 1175.33
Levels List for use August 11th
1382.33 (Weekly R3)
1343.25 (Resistance)
1330.58 (Weekly R2)
1328.75 (Resistance)
1316.75 (Resistance)
1311.42 (Weekly R1)
1300.50 (Resistance)
1295.00 (Resistance)
1294.00 (Daily Point of Control)
1284.08 (Daily Pivot Point)
1278.83 (Weekly Pivot Point)
1259.67 (Weekly S1)
1227.08 (Weekly S2)
1175.33 (Weekly S3)
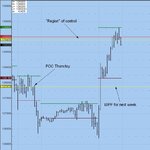
Pivot Point/Point of Control Confluence
I thought I'd post the following chart as it illustrates something which seems to occur quite often - confluence between a key Pivot level and a key Market Profile level.
In this case, yesterday the market blasted through Thursday's Point of Control of 1278.75(which I shorted and lost on), and didn't pause for a re-test.
Interestingly, this level is the Weekly Pivot Point for next week, meaning the first test of the Weekly Pivot Point will also be the first test of Thursday's Point of Control.
The chart also illustrates that sometimes the Point of Control is more like a "Region" of control spread over several prices.
Attachments
rathcoole_exile
Guest Author
- Messages
- 3,925
- Likes
- 767
Trade1 Resistance (1300.50)
Sold at 1299.75
Stop at 1302.25
Exit at 1302.25
Gross p/l = -2.50
No capacity for more trades, so also total for the day.
🙁
i had a Stop order to short at more or less the same price area (1298), luckily i didn't get triggered.
Now gone short at 1308 coming off the WR1
rathcoole_exile
Guest Author
- Messages
- 3,925
- Likes
- 767
got stopped out for -3
then went again a few minutes later 1308 to 1302 for +6
then went again a few minutes later 1308 to 1302 for +6
got stopped out for -3
then went again a few minutes later 1308 to 1302 for +6
Yes, even if I'm out for the day, it's a confidence booster to see clear reactions off the levels.
Numbers for use August 12th
1382.33 (Weekly R3)
1343.25 (Resistance)
1330.58 (Weekly R2)
1328.75 (Resistance)
1316.75 (Resistance)
1311.42 (Weekly R1)
1310.00 (Resistance)
1304.75 (Daily Point of Control)
1302.17 (Daily Pivot Point)
1278.83 (Weekly Pivot Point)
1259.67 (Weekly S1)
1227.08 (Weekly S2)
1175.33 (Weekly S3)
1382.33 (Weekly R3)
1343.25 (Resistance)
1330.58 (Weekly R2)
1328.75 (Resistance)
1316.75 (Resistance)
1311.42 (Weekly R1)
1310.00 (Resistance)
1304.75 (Daily Point of Control)
1302.17 (Daily Pivot Point)
1278.83 (Weekly Pivot Point)
1259.67 (Weekly S1)
1227.08 (Weekly S2)
1175.33 (Weekly S3)
Numbers for use Aug 13th
The Daily Pivot Point contained the RTH session range yesterday, being first tested in the opening time bracket.
1382.33 (Weekly R3)
1343.25 (Resistance)
1330.58 (Weekly R2)
1328.75 (Resistance)
1316.75 (Resistance)
1311.42 (Weekly R1)
1310.00 (Resistance)
1297.50 (Daily Point of Control)
1294.83 (Daily Pivot Point)
1278.83 (Weekly Pivot Point)
1259.67 (Weekly S1)
1227.08 (Weekly S2)
1175.33 (Weekly S3)
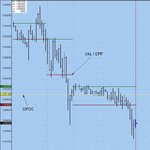
Overnight Point of Control + Thoughts
Today, I'm introducing the Overnight Point of Control as a level, mainly to see how the market reacts to it.
The level is 1291.00, pretty much in line with Yesterday's Close.
Also, today is interesting as there is confluence between yesterday's VAL and the Daily Pivot Point (1294.75)
The chart attached illustrates both levels.
Attachments
rathcoole_exile
Guest Author
- Messages
- 3,925
- Likes
- 767
i'm heavily short from 1277.75,
this is easily the biggest trade I have ever put on - it just looked so right, price breaking through weekly PP, camarilla L4, DeMark L,
have already closed some contracts (1 point x 9 contracts; 1.75 points x 9 contracts; 2.25 points x 9 contracts; 2.75 points x 9 contracts - still have 64 contracts running...... oops ! but Stop Loss now at B/E for the remaining contracts )
ha ha, lol, stop got hit just as i posted this .... might look for another opportunity to get back in short again ....
rathcoole_exile
Guest Author
- Messages
- 3,925
- Likes
- 767
short again at 1277.75 x 64 contracts
55 contracts all at staggered exit intervals all got hit so quickly, i've only got 9 contracts left alive !!!
i've brought SL to B/E and set the final TP target way down the ladder, just above 1273, the Floor R2
turning out to be a nice evening's work 🙂
......
SL hit, closed out for a staggering 115 full ES points. this calls for a large whiskey 🙂
Last edited:
short again at 1277.75 x 64 contracts
55 contracts all at staggered exit intervals all got hit so quickly, i've only got 9 contracts left alive !!!
i've brought SL to B/E and set the final TP target way down the ladder, just above 1273, the Floor R2
turning out to be a nice evening's work 🙂
There's a guy elsewhere on this forum asking how he can cut down overtrading. I'm convinced the answer is to pick big levels/pivots and employ a scaling out strategy like you've done, Garry. Pick something you really believe in and max out.
I've been looking at the Bund and the 10-year note and the same things work...
Delighted for you by the way👍
Last edited:
- Status
- Not open for further replies.