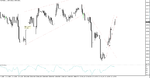
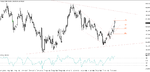
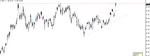
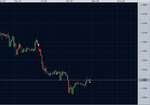
EJ 1H
Prices broke the trend line of the major channel in a tight channel (1), which is also a spike.
Pulled back in two legs (first leg end with the bull bar after the doji bar), which also broke another channel (2).
Bar A is a fail BO ( of the channel 2) and a BO Pullback (of the upper trend line of the major channel).
Now a possible expanding channel.
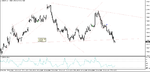
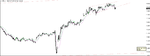
With a larger channels is best to enter with a reversal patter, in a very tight channel or spikes is best to enter with limit orders at the touch of the channel having a SL below the previous swing low(for long), if RR makes sense.
This is a spike, if you buy with a limit order at 1, your SL should be below 2.
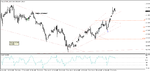
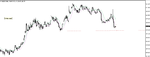
Disregard taking profit based on great RR (1:2 or 1:3), that is BS literature.
Take what is given but letting run his course is also important, personally I take profit at the end of NA close, some time is less than my risk, often is equal to my risk and a few times is 6-7 times my risk.