You are using an out of date browser. It may not display this or other websites correctly.
You should upgrade or use an alternative browser.
You should upgrade or use an alternative browser.
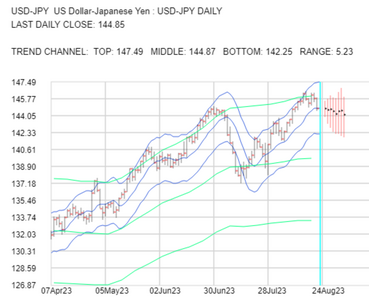
Hi ff40e, thank you for your USDJPY post. I attach my USDJPY chart using a daily short term trend channel (STTC) shown in blue top, middle and bottom and a weekly long term trend channel (LTTC) shown in green top, middle and bottom.
The USDJPY closed the day today at the middle of its STTC.
For the USDJPY to start trending downwards then it has to find resistance below the middle of its STTC which is currently at 144.87 for tomorrow. The bottom of its STTC is currently at 142.25. So to arrive at your target 141.497 then the STTC has to start falling.
I will post my STTC-LTTC chart again in a few days time to see if the middle of the STTC has become a resistance.
gka
Attachments
Here are my predictions for USDJPY starting this week 4 September.Hi ff40e, thank you for your USDJPY post. I attach my USDJPY chart using a daily short term trend channel (STTC) shown in blue top, middle and bottom and a weekly long term trend channel (LTTC) shown in green top, middle and bottom.
The USDJPY closed the day today at the middle of its STTC.
For the USDJPY to start trending downwards then it has to find resistance below the middle of its STTC which is currently at 144.87 for tomorrow. The bottom of its STTC is currently at 142.25. So to arrive at your target 141.497 then the STTC has to start falling.
I will post my STTC-LTTC chart again in a few days time to see if the middle of the STTC has become a resistance.
gka
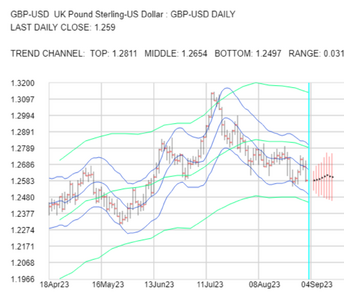
I am attaching charts for GBPUSD, USDJPY and GBPJPY because they are related by
GBPUSD X USDJPY = GBPJPY
I find that analysing three FX pairs in a triplet provides more information because the analysis of all three has to be consistent. So if GBPUSD and USDJPY analysis is bullish then a bearish analysis of GBPJPY cannot be correct.
In the three charts attached I use a Short Term Trend Channel (STTC) in blue calculated using daily high/low/close and a Long term Trend Channel (LTTC) shown in green calculated using weekly high/low/close. Each chart lists the top, middle, bottom and range of the STTC for tomorrow 4 September.
When an FX pair is rising in the short term then the middle of the STTC is a support and conversely when the FX pair is falling then the middle of the STTC becomes a resistance.
Similarly when an FX pair is rising in the long term then the middle of the LTTC is a support and conversely when the FX pair is falling then the middle of the LTTC becomes a resistance.
Reading from the charts attached:
- GBPUSD became long term bearish about 4 weeks ago and both its STTC and LTTC are now falling
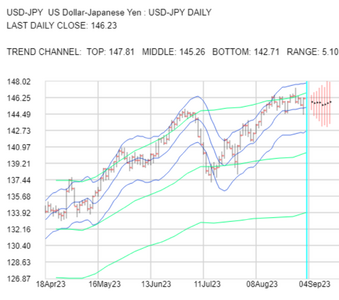
- USDJPY still has rising STTC and LTTC so bullish in the short and long term.
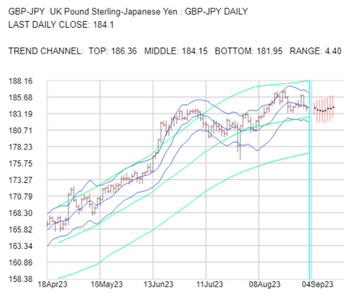
- GBPJPY has a falling STTC and a rising LTTC. So bearish in the short term but still bullish in the long term.
gka
Attachments
I attach the latest charts for GBPUSD, USDJPY and GBPJPY in the triplet
GBPUSD X USDJPY = GBPJPY
for the week starting 11th September.
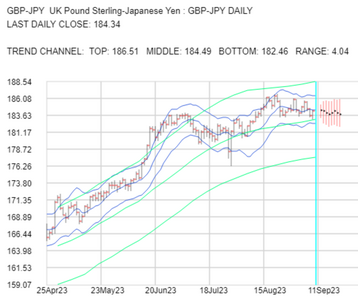
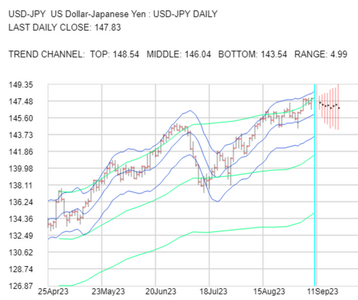
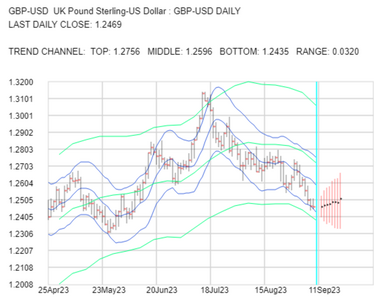
On all charts, short term trend channel (STTC) drawn in blue with top, middle, bottom and range for the STTC above the chart for 11th September
Long term trend channel (LTTC) top, middle and bottom drawn in green on all charts.
GBPUSD has falling STTC and LTTC
USDJPY has rising STTC and LTTC
So both GBPUSD and USDJPY continue to buy USD in both the short and long term.
GBPJPY STTC moving sideways and LTTC rising. So no direction is short term but buying GBP in the long term.
I will upload the next charts for these 3 triplets when there is a change of trend direction.
gka
GBPUSD X USDJPY = GBPJPY
for the week starting 11th September.
On all charts, short term trend channel (STTC) drawn in blue with top, middle, bottom and range for the STTC above the chart for 11th September
Long term trend channel (LTTC) top, middle and bottom drawn in green on all charts.
GBPUSD has falling STTC and LTTC
USDJPY has rising STTC and LTTC
So both GBPUSD and USDJPY continue to buy USD in both the short and long term.
GBPJPY STTC moving sideways and LTTC rising. So no direction is short term but buying GBP in the long term.
I will upload the next charts for these 3 triplets when there is a change of trend direction.
gka
Attachments
Here is an update to the charts I already posted for the triplet
GBPUSD X USDJPY = GBPJPY
Analysing FX pairs in triplets because of arbitrage gives additional information.
I use daily H/L/C values to calculate a short term trend channel (STTC) 1 day into the future. The top middle and bottom of this STTC are shown in blue on the attached charts and listed at the top of the charts.
I use weekly H/L/C values to calculate a long term trend channel (LTTC) 1 week into the future. The top middle and bottom of this LTTC are shown in green on the attached charts.
The direction of the STTC and LTTC, whether the STTC breaks through the LTTC and how the market is interacting with the top, middle and bottom of the STTC and the LTTC can then be used for analysis.
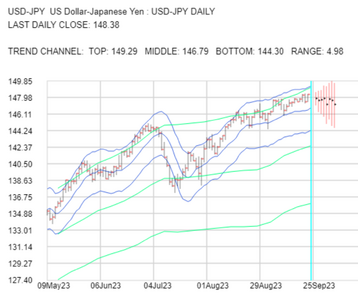
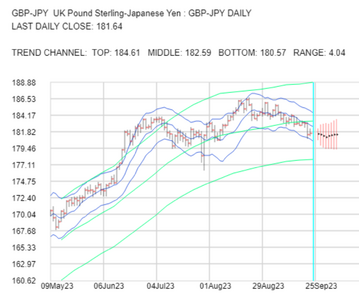
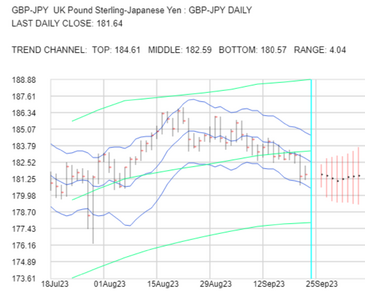
Four charts attached for tomorrow 25th September:
Anyone wanting further info can message me.
gka
GBPUSD X USDJPY = GBPJPY
Analysing FX pairs in triplets because of arbitrage gives additional information.
I use daily H/L/C values to calculate a short term trend channel (STTC) 1 day into the future. The top middle and bottom of this STTC are shown in blue on the attached charts and listed at the top of the charts.
I use weekly H/L/C values to calculate a long term trend channel (LTTC) 1 week into the future. The top middle and bottom of this LTTC are shown in green on the attached charts.
The direction of the STTC and LTTC, whether the STTC breaks through the LTTC and how the market is interacting with the top, middle and bottom of the STTC and the LTTC can then be used for analysis.
Four charts attached for tomorrow 25th September:
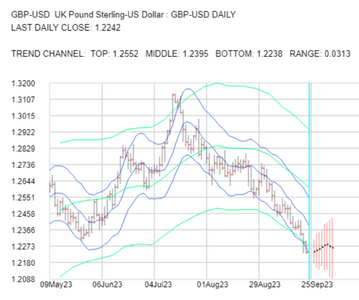
- 2023-09-25-GBPUSD-1day.png showing the continuing fall of its STTC and LTTC which started on 10th August
- 2023-09-25-USDJPY-1day.png showing the LTTC and STTC of USDJPY continuing to rise.
- 2023-09-25-GBPJPY-1day.png showing the STTC and LTTC of GBPJPY.
- 2023-09-25-GBPJPY-1day-zoom.png which is the GBPJPY chart zoomed in. This shows how GBPJPY finally became short and long term bearish last week on the 20th September.
Anyone wanting further info can message me.
gka
Attachments
MrMosquito
Junior member
- Messages
- 48
- Likes
- 3
the bullish wave can not end until the price line raises to 148, this is my personal view and is not fully trusted.Hi i want to share my chart of USDJPY. You are gonna see 1D, 4H, 15M charts in a row. Its my first thread so im quite amateur. You can feedback me about thread or chart.
View attachment 330116View attachment 330117View attachment 330118
Here is an update to the charts I already posted for the triplet
GBPUSD X USDJPY = GBPJPY
Analysing FX pairs in triplets because of arbitrage gives additional information.
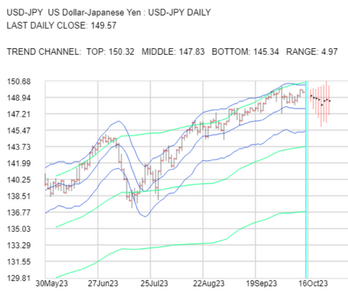
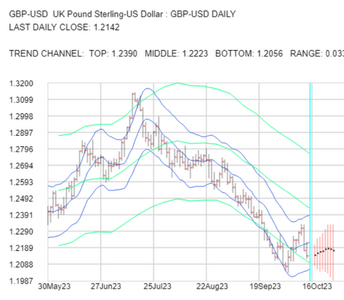
I use daily H/L/C values to calculate a short term trend channel (STTC) 1 day into the future. The top middle and bottom of this STTC are shown in blue on the attached charts and listed at the top of the charts for 16th October.
I use weekly H/L/C values to calculate a long term trend channel (LTTC) 1 week into the future. The top middle and bottom of this LTTC are shown in green on the attached charts.
The direction of the STTC and LTTC, whether the STTC breaks through the LTTC and how the market is interacting with the top, middle and bottom of the STTC and the LTTC can then be used for analysis.
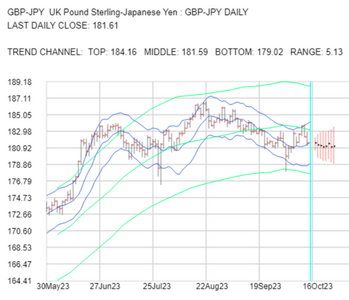
Three charts attached for tomorrow 16th October:
GBPUSD X USDJPY = GBPJPY
Analysing FX pairs in triplets because of arbitrage gives additional information.
I use daily H/L/C values to calculate a short term trend channel (STTC) 1 day into the future. The top middle and bottom of this STTC are shown in blue on the attached charts and listed at the top of the charts for 16th October.
I use weekly H/L/C values to calculate a long term trend channel (LTTC) 1 week into the future. The top middle and bottom of this LTTC are shown in green on the attached charts.
The direction of the STTC and LTTC, whether the STTC breaks through the LTTC and how the market is interacting with the top, middle and bottom of the STTC and the LTTC can then be used for analysis.
Three charts attached for tomorrow 16th October:
- 2023-10-16-GBPUSD-1day.png showing the rebound of the middle of its STTC off the bottom of its LTTC on 5th October.
- 2023-10-16-USDJPY-1day.png showing the top of its STTC breaking back down through the top of its LTTC on 11th October Its STTC is now horizontal so not showing short term bullishness as of tomorrow.
- 2023-10-16-GBPJPY-1day.png shows the FX pair making a rebound off the bottom of its LTTC on 3rd October. Then testing the middle of its LTTC two days ago. Until GBPJPY breaks up through the middle of its LTTC and finds support then GBPJPY continues to be long term bearish.
Attachments
MrMosquito
Junior member
- Messages
- 48
- Likes
- 3
Interestingggg, I had heard of arbitraging with forex pairs, i never understood how it worked, I did do it for crypto as i could buy and sell evey one against another but for forex, as i had to keep the base of my account as USD, i didnt have any idea how to doit, Thans a lot, it was probably one of the most useful things posted here.Here is an update to the charts I already posted for the triplet
GBPUSD X USDJPY = GBPJPY
Analysing FX pairs in triplets because of arbitrage gives additional information.
I use daily H/L/C values to calculate a short term trend channel (STTC) 1 day into the future. The top middle and bottom of this STTC are shown in blue on the attached charts and listed at the top of the charts for 16th October.
I use weekly H/L/C values to calculate a long term trend channel (LTTC) 1 week into the future. The top middle and bottom of this LTTC are shown in green on the attached charts.
The direction of the STTC and LTTC, whether the STTC breaks through the LTTC and how the market is interacting with the top, middle and bottom of the STTC and the LTTC can then be used for analysis.
Three charts attached for tomorrow 16th October:
gka
- 2023-10-16-GBPUSD-1day.png showing the rebound of the middle of its STTC off the bottom of its LTTC on 5th October.
- 2023-10-16-USDJPY-1day.png showing the top of its STTC breaking back down through the top of its LTTC on 11th October Its STTC is now horizontal so not showing short term bullishness as of tomorrow.
- 2023-10-16-GBPJPY-1day.png shows the FX pair making a rebound off the bottom of its LTTC on 3rd October. Then testing the middle of its LTTC two days ago. Until GBPJPY breaks up through the middle of its LTTC and finds support then GBPJPY continues to be long term bearish.
Hi MrMosquito, thank you for your feedback. Here are more arbitrage points to think about....
So far I posted for the FX triplets
GBPUSD X USDJPY = GBPJPY
However USDJPY also forms a triplet with
EURUSD X USDJPY = EURJPY
So GBPUSD is also connected to EURJPY by these two triplet relationships. Whether GBPUSD is buying or selling has implications for EURJPY through the relationships above and how USDJPY responds. In fact all FX pairs are interrelated by such triplet relationships above. So the sum total of all the FX markets is like a giant interconnection of FX pairs. One FX pair is volatile and FX pairs respond somewhere else. I have seen GBPUSD respond with volatility when the Australian central bank has changed its interest rates.
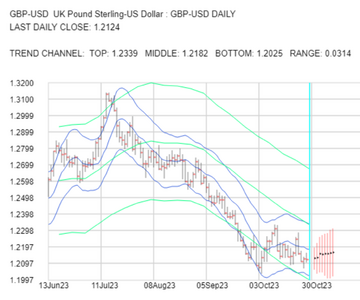
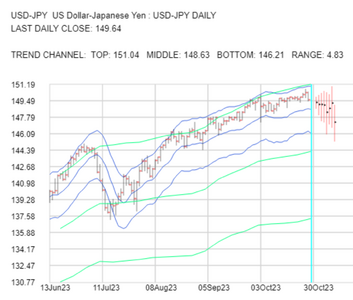
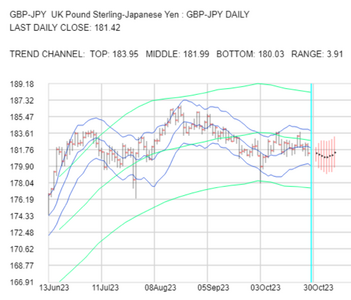
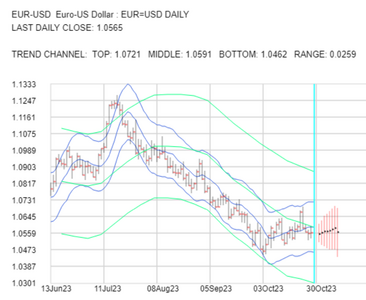
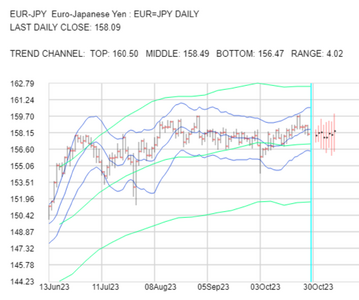
I attach charts for next week starting 30 October for the five FX pairs above. I calculate short term trend channels (STTC) one day into the future in blue and long term trend channels (LTTC) one week into the future in green, shown top, middle and bottom in the charts. Each chart also lists the top, middle, bottom and range of the STTC for each FX for tomorrow 30 October.
I decide whether an FX pair is bullish or bearish by whether it is above or below the middle of the corresponding trend channel.
Reading from the charts:
GBPUSD short term bearish. long term bearish
USDJPY short term bullish, long term bullish
GBPJPY short term bearish. long term bearish
EURUSD short term bearish. long term bearish
EURJPY short term bearish. long term bullish
So far I posted for the FX triplets
GBPUSD X USDJPY = GBPJPY
However USDJPY also forms a triplet with
EURUSD X USDJPY = EURJPY
So GBPUSD is also connected to EURJPY by these two triplet relationships. Whether GBPUSD is buying or selling has implications for EURJPY through the relationships above and how USDJPY responds. In fact all FX pairs are interrelated by such triplet relationships above. So the sum total of all the FX markets is like a giant interconnection of FX pairs. One FX pair is volatile and FX pairs respond somewhere else. I have seen GBPUSD respond with volatility when the Australian central bank has changed its interest rates.
I attach charts for next week starting 30 October for the five FX pairs above. I calculate short term trend channels (STTC) one day into the future in blue and long term trend channels (LTTC) one week into the future in green, shown top, middle and bottom in the charts. Each chart also lists the top, middle, bottom and range of the STTC for each FX for tomorrow 30 October.
I decide whether an FX pair is bullish or bearish by whether it is above or below the middle of the corresponding trend channel.
Reading from the charts:
GBPUSD short term bearish. long term bearish
USDJPY short term bullish, long term bullish
GBPJPY short term bearish. long term bearish
EURUSD short term bearish. long term bearish
EURJPY short term bearish. long term bullish
Attachments
I attach updated charts for the five FX pairs in the following two triplets:
GBPUSD X USDJPY = GBPJPY
EURUSD X USDJPY = EURJPY
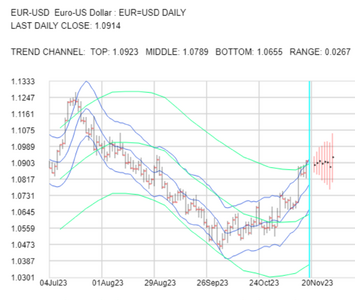
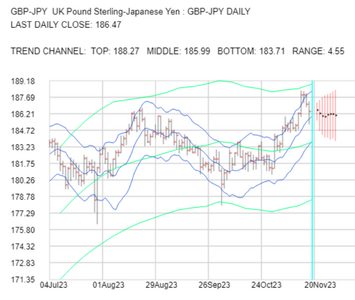
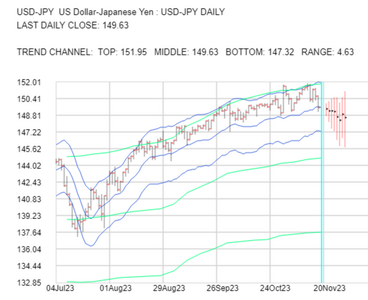
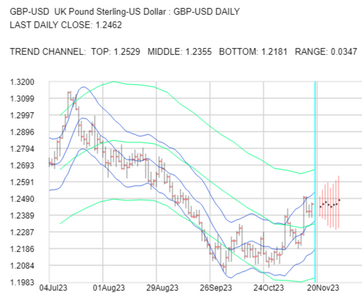
Charts show predictions for Monday 20th November and 99 daily predictions and results (High/Low/Close) from the past. Blue curves show the top, middle and bottom of the Short Term Trend Channel (STTC) of each pair and the green curves show the top, middle and bottom of the Long Term Trend Channel (LTTC) of each pair.
The top, middle and bottom of each STTC are listed at the top of each chart.
Points of interest:
GBPUSD X USDJPY = GBPJPY
EURUSD X USDJPY = EURJPY
Charts show predictions for Monday 20th November and 99 daily predictions and results (High/Low/Close) from the past. Blue curves show the top, middle and bottom of the Short Term Trend Channel (STTC) of each pair and the green curves show the top, middle and bottom of the Long Term Trend Channel (LTTC) of each pair.
The top, middle and bottom of each STTC are listed at the top of each chart.
Points of interest:
- GBPUSD became short term bullish and long term bullish on 14th November. Both its STTC and LTTC are now rising.
- USDJPY continued its upward trend but as of Friday 17th November it closed at 149.63 which was below the middle of its Friday STTC at 149.69. If the middle of its STTC becomes a resistance level then USDJPY will become short term bearish. However it will have to break down through the middle of its LTTC currently at 144.78 before it becomes long term bearish.
- GBPJPY became short and long term bullish when it broke up through the middle of its STTC and LTTC on 31st October
- EURUSD became short and long term bullish when the middle of its STTC broke up through the middle of its LTTC on 3rd November
- EURJPY continues to be short and long term bullish. However EURJPY reached the top of its LTTC so rebounds down can be possible.
Attachments
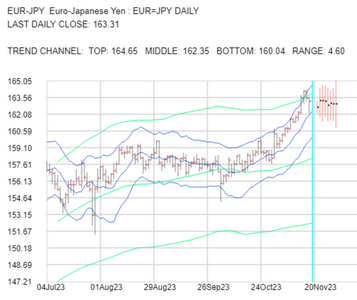
I attach updated charts for the five FX pairs in the following two triplets:
GBPUSD X USDJPY = GBPJPY
EURUSD X USDJPY = EURJPY
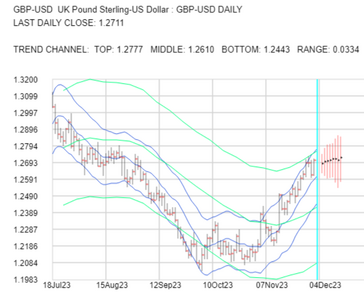
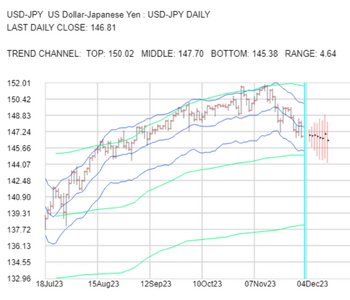
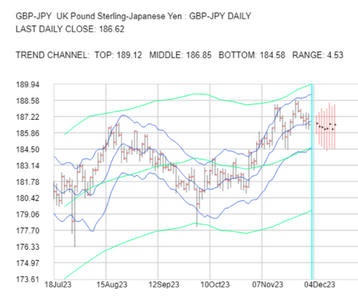
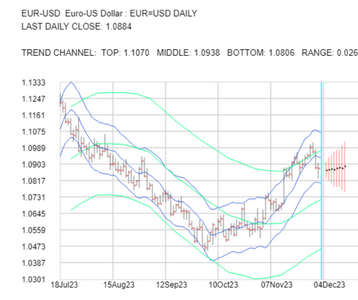
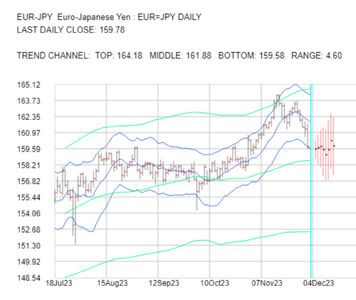
Charts show predictions for Monday 4th December and 99 daily predictions and results (High/Low/Close) from the past. Blue curves show the top, middle and bottom of the Short Term Trend Channel (STTC) of each pair one day into the future and the green curves show the top, middle and bottom of the Long Term Trend Channel (LTTC) of each pair one week into the future.
The top, middle and bottom of each STTC for 4th December are listed at the top of each chart.
Points of interest:
GBPUSD X USDJPY = GBPJPY
EURUSD X USDJPY = EURJPY
Charts show predictions for Monday 4th December and 99 daily predictions and results (High/Low/Close) from the past. Blue curves show the top, middle and bottom of the Short Term Trend Channel (STTC) of each pair one day into the future and the green curves show the top, middle and bottom of the Long Term Trend Channel (LTTC) of each pair one week into the future.
The top, middle and bottom of each STTC for 4th December are listed at the top of each chart.
Points of interest:
- GBPUSD is still short and long term bullish with its STTC and LTTC rising.
- The USDJPY chart for 20th November in the last post indicated the start of a short term fall and this happened over the last two weeks. The STTC for USDJPY is now falling and has become short term bearish. Its LTTC has also flattened out. The middle of the LTTC for USDJPY is 144.96. If USDJPY falls through this level this week and becomes a resistance level then USDJPY will become long term bearish.
- GBPJPY still has a rising STTC and LTTC but the middle of its STTC tomorrow at 186.85 could become a resistance level and GBPJPY would then become short term bearish.
- EURUSD fell below the middle of its STTC last Thursday and is now short term bearish but still long term bullish.
- EURJPY fell below the middle of its STTC last Tuesday so is now short term bearish but still long term bullish.
Attachments
Similar threads
- Replies
- 4
- Views
- 4K