So, an analyst at Citigroup reckons that the FTSE 100 should double in value over the next 10 years. Actually, were that to happen (but see below) it would be no big deal as the FTSE has doubled in value no less than 4 times since its launch in April 1984 and, each time, it has taken far less than 10 years to do it –
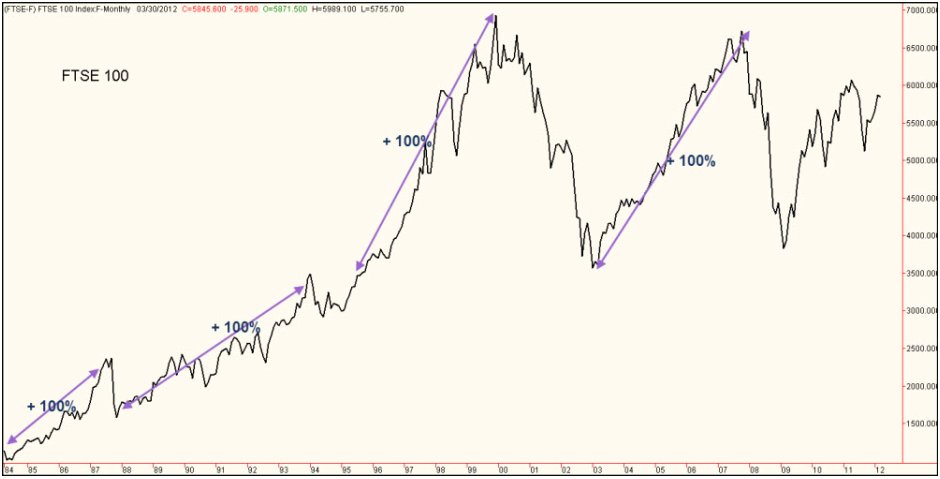
April 1984 @ 1150 - doubled to 2300 by May 1987 = 3 years
Oct 1987 @ 1580 - doubled to 3160 by Sept 1993 = 6 years
June 1994 @ 2900 - doubled to 5800 by Feb 1998 = 3.75 years
March 2003 @ 3500 - doubled to 7000 by Oct 2007 = 4.5 years
So, on the face of it, the idea that it might double over the next 10 years is no great shakes; history of the FTSE shows that it could do it in the next 3 to 5 years, tops! But - and it is a big BUT - this time it is different; this time it will be more problematic. Note from the above chart that each of the first 3 +100% hikes was achieved without there being any obvious overhead resistance created by earlier significant highs and how the 4th and latest +100% hike (’94 to ’98) ended at the level of the resistance presented by the Jan 2000 all-time-high.
If there is to be another +100% hike then it has first to overcome that same serious resistance presented by the Jan 2000 high plus it also has now to cope with the Jul/Nov 2007 highs as well as the 2011 highs at the 6055/6090 area. None of which is going to be a pushover.
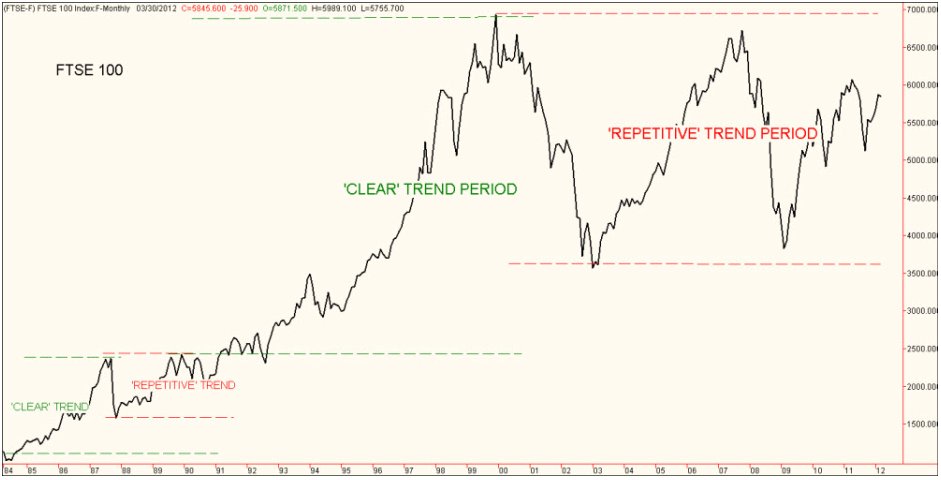
Looking from the long term perspective it can be clearly seen that three of the four +100% sets of gains on the FTSE were achieved during a ‘clear’ trend period - i.e during a strong uptrend with no preceding significant highs to provide resistance; whereas, until the 7000 level is left behind, the FTSE continues in a ‘Repetitive’ trend scenario having to contend with resistance caused by previous significant highs –
So, with the history of the FTSE as our guide we would suggest that the Citigroup analysis could have been more comprehensive and made more accurate by rewriting it as…. “If the FTSE 100 can get above 7000 it should then be able to double in value within the following 3 to 5 years”!
But there is another, and perhaps more dangerous, aspect to the Citigroup assertion and that is that it implies that the +100% increase is starting from now. We would not be so cynical as to suggest that the main purpose of the assertion is to encourage people to invest into the stock market now (and particularly into Citigroup funds) but that is certainly a possibility.
The dangerous aspect of that is that the FTSE 100 is now at a level of considerable overhead resistance which could send it back down by 1000 points or so - and in the relatively near future. Regular readers of the ‘FTSE Forecast’ will know that the result of a 5th attempt at any particular level of resistance (or support) is almost invariably followed by a fast and wide move - up or down depending on whether the attempt succeeded or failed. And here we have the FTSE about to make a 5th attempt at a breakout above the 6055/6090 area resistance –
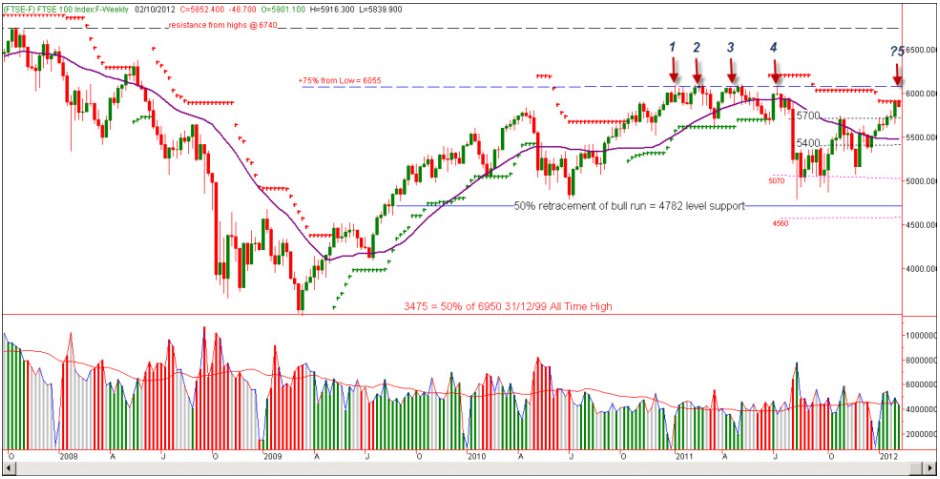
If it succeeds then it is likely to move quickly up to test the 7000 level; if it fails then it could fall rapidly back to the 5000 area (if not lower still!).
There is though continuing support for all of the major market indices on both sides of the Atlantic (which is serving to confirm the positive market ‘tests’ that were evident last week as the charts below illustrate, so a successful 5th attempt breakout above 6055/6090 on the FTSE does look probable. However, we still have the background concern of the picture presented by the Momentum Indicator (‘MI’) which is continuing to drift downwards rather than showing an upward slope in support of the major indices.
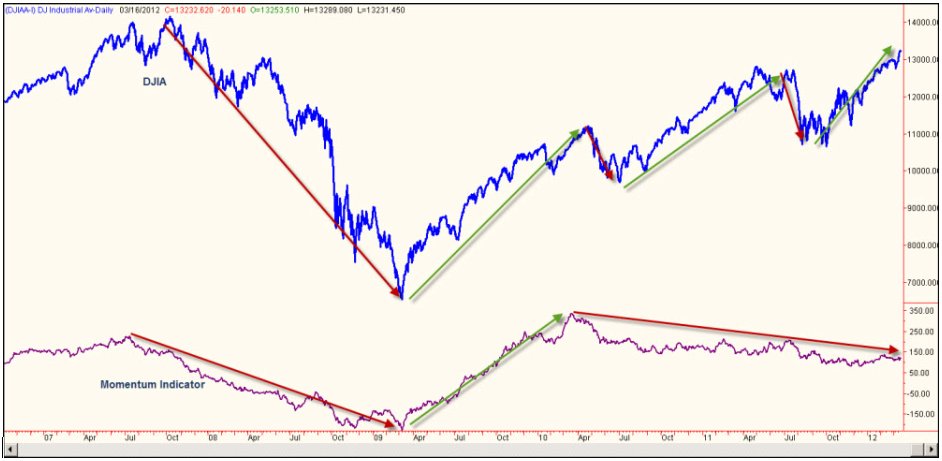
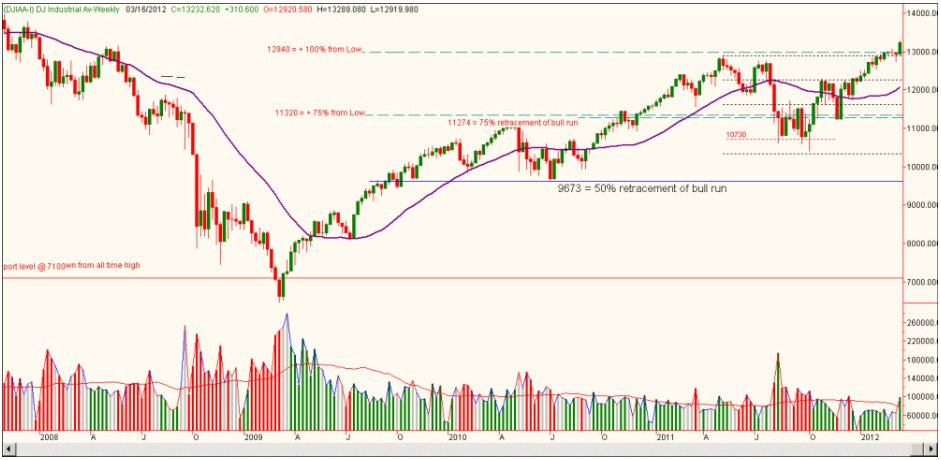
As a point of reference the DJIA, which has risen strongly of late, has done so without the apparent support of the MI - and that could lead to trouble and a DJIA (and S&P 500 and FTSE 100 and 250) reversal -
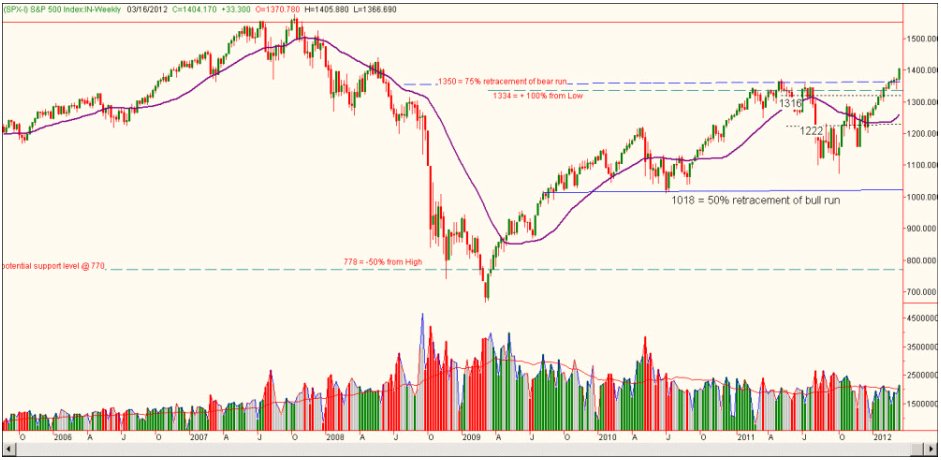
The DJIA and the S&P 500 have been well supported and have moved up through resistance (although the moves have yet to be consolidated and confirmed) -
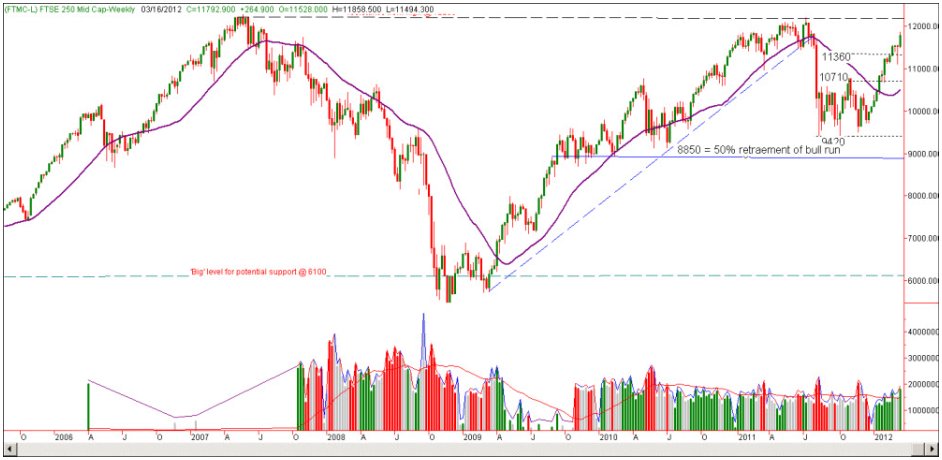
This is a positive development and one which has pulled both the FTSE 100 and the FTSE 250 upwards and closer to their coming battles with overhead resistance -
So, whilst you may be reasonably well exposed to the Long side of both or either of the UK and US markets we suggest that you should not be counting on a 10 year bull run starting now (but we wouldn’t grumble, and we would send a bottle of bubbly to the Citigroup analyst, if it did!).
Alan Saunders can be contacted at ShareHunter.com
April 1984 @ 1150 - doubled to 2300 by May 1987 = 3 years
Oct 1987 @ 1580 - doubled to 3160 by Sept 1993 = 6 years
June 1994 @ 2900 - doubled to 5800 by Feb 1998 = 3.75 years
March 2003 @ 3500 - doubled to 7000 by Oct 2007 = 4.5 years
So, on the face of it, the idea that it might double over the next 10 years is no great shakes; history of the FTSE shows that it could do it in the next 3 to 5 years, tops! But - and it is a big BUT - this time it is different; this time it will be more problematic. Note from the above chart that each of the first 3 +100% hikes was achieved without there being any obvious overhead resistance created by earlier significant highs and how the 4th and latest +100% hike (’94 to ’98) ended at the level of the resistance presented by the Jan 2000 all-time-high.
If there is to be another +100% hike then it has first to overcome that same serious resistance presented by the Jan 2000 high plus it also has now to cope with the Jul/Nov 2007 highs as well as the 2011 highs at the 6055/6090 area. None of which is going to be a pushover.
Looking from the long term perspective it can be clearly seen that three of the four +100% sets of gains on the FTSE were achieved during a ‘clear’ trend period - i.e during a strong uptrend with no preceding significant highs to provide resistance; whereas, until the 7000 level is left behind, the FTSE continues in a ‘Repetitive’ trend scenario having to contend with resistance caused by previous significant highs –
So, with the history of the FTSE as our guide we would suggest that the Citigroup analysis could have been more comprehensive and made more accurate by rewriting it as…. “If the FTSE 100 can get above 7000 it should then be able to double in value within the following 3 to 5 years”!
But there is another, and perhaps more dangerous, aspect to the Citigroup assertion and that is that it implies that the +100% increase is starting from now. We would not be so cynical as to suggest that the main purpose of the assertion is to encourage people to invest into the stock market now (and particularly into Citigroup funds) but that is certainly a possibility.
The dangerous aspect of that is that the FTSE 100 is now at a level of considerable overhead resistance which could send it back down by 1000 points or so - and in the relatively near future. Regular readers of the ‘FTSE Forecast’ will know that the result of a 5th attempt at any particular level of resistance (or support) is almost invariably followed by a fast and wide move - up or down depending on whether the attempt succeeded or failed. And here we have the FTSE about to make a 5th attempt at a breakout above the 6055/6090 area resistance –
If it succeeds then it is likely to move quickly up to test the 7000 level; if it fails then it could fall rapidly back to the 5000 area (if not lower still!).
There is though continuing support for all of the major market indices on both sides of the Atlantic (which is serving to confirm the positive market ‘tests’ that were evident last week as the charts below illustrate, so a successful 5th attempt breakout above 6055/6090 on the FTSE does look probable. However, we still have the background concern of the picture presented by the Momentum Indicator (‘MI’) which is continuing to drift downwards rather than showing an upward slope in support of the major indices.
As a point of reference the DJIA, which has risen strongly of late, has done so without the apparent support of the MI - and that could lead to trouble and a DJIA (and S&P 500 and FTSE 100 and 250) reversal -
The Momentum Indicator and DJIA –
The DJIA and the S&P 500 have been well supported and have moved up through resistance (although the moves have yet to be consolidated and confirmed) -
The DJIA Weekly –
The S&P 500 Weekly –
This is a positive development and one which has pulled both the FTSE 100 and the FTSE 250 upwards and closer to their coming battles with overhead resistance -
The FTSE 250 –
So, whilst you may be reasonably well exposed to the Long side of both or either of the UK and US markets we suggest that you should not be counting on a 10 year bull run starting now (but we wouldn’t grumble, and we would send a bottle of bubbly to the Citigroup analyst, if it did!).
Alan Saunders can be contacted at ShareHunter.com
Last edited by a moderator: