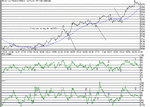
Just a quick chart to show the in and out points over the last couple of days, using just RSI and CCI. A combination of >50 RSI and >100 CCI to get in, and neg divergence or crossing below 100MA to get out. Arrows show the approxiamate points. Just going long would have netted 170 points today in 3 "safe" trades. Staying long all day would have got 200 odd points...

