Individual share price forecast

danboi8989

Member
Messages
63
Likes
2
I am creating this blog in order to use my knowledge of 5 years Technical Analysis practice combined with my Fundamental knowledge of the markets and Macro-economy to analyse the markets and come up with certain share price forecasts.

The share price forecasts' in this blog will benefit anyone trading equities on the market through any method. I am not telling people what to invest their money in. This is not a tips page. I am merely giving people ideas and information so they can further their research in the chosen equities, or perhaps give them another perspective to look at.

Trading the markets is difficult and every little edge you can gain helps to keep your profits in positive territory (which is why we are all trading I presume).

I am open to any feedback at any time in my blog so please feel free to comment or share your views. My 1st share price forecast will soon be posted, so keep an eye out!
 
Apple share price forecast

Over the past few days I have analysed Apple. I will give you my share price forecast in both the short and long term, The indicators I have used are simple yet i find them very effective as oppose to having a chart covered in different complicated indicators contradicting each other.. Firstly short term;

Short Term
2013-11-14_ARL-51048.jpg
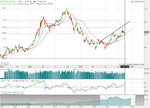
Short term I am bullish on Apple share price forecast. In this diagram we should pay more attention to the trend channels on the right hand side that are showing a bullish bounce in a upward trend. The current price is nearing the bottom trend line and I believe it could cause an upward bounce towards the upper trend line as previously displayed. Also the 76.6% Fibonacci retracement line has twice proven to be good support for the price.

Long Term
2013-11-14_ARL-51048 longt (1).jpg
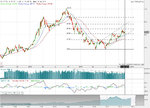
From a long term approach I would be a little more caution and my opinions are quite bearish. IF price in the short run heads up towards the top trend line it will also be nearing the 61.8% Fibonacci line which in my opinion proves to be a more significant resistance point than the 76.6% mark previously shown. Also, although there has been a short term up trend in price volume has been steadily decreasing as you can see by the trend line I have illustrated. Finally the MACD indicators have crossed and are lying in the overbought section. This is just another bearish signal that is tempting me to be long term short on this security.

Just as a foot note, and my personal opinion. Apple is not what it used to be and Android products appear to be cheaper and provide the same utility.

Again please feel free to agree/disagree or give any feedback. Follow me on twitter @danboi8989, or search Daniel Lummis and connect via Linkedin to keep up to date with my share price forecast. This is FREE and purely EDUCATIONAL information. I am not a tipster attempting to make a profit. Only maximize your profits!
 
Last edited:
good luck with this

remember the more complex you make things the easier it is to make decisions

N
 
apologies i have looked back here and am being unfair in my generalisations ..........

good luck with the thread - but please please please not another 400 line assault on the sences that gives no direction or decisions at the end

thanks !
N
 
Forecast - Short FTSE100 futures or stocks strongly correlated to the Index - I beleive the FTSE100 is due for a strong retracement back to potentially 6500 levels. Looking at the Daily, Weekly and Monthly charts indicates that it may have hit a strong resistance point in all cases. I would wait for a bearish confirmation before making any decisions (A bearish candlestick on the daily perhaps??).

Remember this is my personal opinion which can be subject to error so please let me know what you think after conducting your own research.
The feedback positive or negative would be apreciated.
 
Top