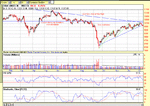
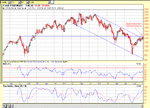
The main indices on both sides of the pond have reached a critical phase, imho.
Firstly, the FTSE100. The breakdown from the diamond at 6037 in Feb 2001 gave a target of 4908 - which seemed a bit extreme at the time, but which I never-the-less plotted on my chart as shown. The pullback to the break in June failed to break the the new resistance at this level, and was the signal for me to go 100% into cash. The short consolidation at around 4700 (shows up better on a daily chart than the weekly one shown) gave a target of 4200, which was hit almost precisely just 2 days later on 210901. However, the last 10 weeks have shown a rounding top to the rally which has petered out at the long-term down trend. This was not placed on a recent best-fit basis, and hasn't been touched since I placed it on the chart back in July 2001- in other words the price has moved to the line, not the other way round. The Fibonacci retracements are drawn from the 1994 lows, and the 50%, 38.2% and 23.6% levels clearly coincide with key support and resistance levels.
The Dow shows a similar pattern. Unfortunately I haven't got eod US stocks or indices in my AIQ databank, but the ProphetFinance charts are still clear enough. The rally from the 210901 lows has traced out a 5 wave structure(shown in green), so a 3 wave decline would be the textbook move now, particularly as the rally has run into resistance at the long term downtrend and also resistance formed by support is now resistance at a similar level. The 21 day RSI and stochastic also show an overbought situation.
Finally the S&P500 is showing a similar pattern. As with the Dow and the FTSE it has run into resistance at the downtrend. There has been an attempt to breakout thru the downtrend, but failed to break the resistance just above the trend.
So we're all doomed then? Well, not necessarily. The case I am making is that we are at a pivotal stage on the main indices. The Nasdaq appears to have already broken its downtrend, although the recovery seems to have temporarily stalled. Just as no uptrend continues for ever, neither does a downtrend. At some stage the down trend must be broken unles the indices are to reach zero, which is not on the agenda for even the most bearish of commentators. But there is still plenty of room below for further falls - Sept 11 just overdid it in the short term in my view, but the downtrend was well established months before, and we may now have just got back to this position. Also shares are still not cheap with no previous major correction having bottomed with p/e ratios as high as they are at the moment.
On the other hand, a recovery in earnings may push the p/e ratios down, and the market will anticipate this by at least 9 months in my view. Certainly the charts will point the way long before the underlying reasons bubble to the surface. Time to watch carefully I think!
Regards, Roger.


