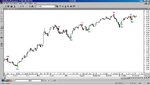
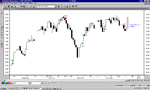
S savemoretax Junior member Messages 33 Likes 0 Dec 10, 2009 #1 Nifty charts on 9-Dec-2009 Attachments nifty.JPG 107.3 KB · Views: 500 Last edited: Dec 10, 2009
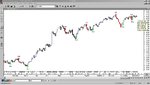
S savemoretax Junior member Messages 33 Likes 0 Dec 10, 2009 #2 Nifty Charts as of 10-Dec-2009 Attachments nifty.JPG 115.1 KB · Views: 377
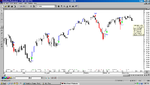
S savemoretax Junior member Messages 33 Likes 0 Dec 16, 2009 #3 Nifty charts as on 16-Dec-2009 Attachments nifty.PNG 56.2 KB · Views: 358
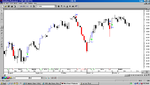
S savemoretax Junior member Messages 33 Likes 0 Dec 21, 2009 #4 Nifty charts as on 18-Dec-2009 Nifty close below 5005 will trigger sell sign. Attachments nifty.PNG 56.9 KB · Views: 413
S savemoretax Junior member Messages 33 Likes 0 Dec 23, 2009 #5 Nifty charts as on 23-Dec-2009 Nifty trend reversal exist at 5043 Attachments nifty.PNG 50.6 KB · Views: 387
S savemoretax Junior member Messages 33 Likes 0 Dec 29, 2009 #6 you can find the latest charts of the nifty at this ... http://power2speed.blogspot.com/2009/12/nifty-charts-as-on-29-dec-2009.html
you can find the latest charts of the nifty at this ... http://power2speed.blogspot.com/2009/12/nifty-charts-as-on-29-dec-2009.html
S savemoretax Junior member Messages 33 Likes 0 Dec 31, 2009 #7 Nifty would be trading sideways with support at 5152
S savemoretax Junior member Messages 33 Likes 0 Dec 31, 2009 #8 Wish You happy new year 2010 Nifty closed at 5200 levels. Ended almost 100% up from 2600 levels. Nice performance in 2009.
Wish You happy new year 2010 Nifty closed at 5200 levels. Ended almost 100% up from 2600 levels. Nice performance in 2009.
S savemoretax Junior member Messages 33 Likes 0 Jan 9, 2010 #11 Check out the trend in Nifty for Monthly charts for complete 15 years. This would help mutual fund investors to reap the benefit. Only patience would let you make money. Trend is your best friend. Use long term charts for trading and investemnts.
Check out the trend in Nifty for Monthly charts for complete 15 years. This would help mutual fund investors to reap the benefit. Only patience would let you make money. Trend is your best friend. Use long term charts for trading and investemnts.
S savemoretax Junior member Messages 33 Likes 0 Jan 18, 2010 #13 Uploaded the charts of nifty and Dow
S savemoretax Junior member Messages 33 Likes 0 Jan 23, 2010 #14 Current trends are available for Nifty(NSE-India)
S savemoretax Junior member Messages 33 Likes 0 Jan 28, 2010 #15 Nifty weekly trend is getting weak. If close below 5050 comes on this friday Nifty weekly trend is down.
Nifty weekly trend is getting weak. If close below 5050 comes on this friday Nifty weekly trend is down.