If everyone uses technical analysis, doesn’t it stop working?

ImogenBeaumont

Junior member
Messages
41
Likes
5
I was wondering if most traders are looking at the same charts, levels, and indicators, wouldn’t their actions cancel each other out? Technical analysis works because people believe in it, but if everyone believes the same thing, does it still provide an edge
 
Most retail traders cancel themselves out. It is what the industry refers to as dumb money.

Big assumption that technical analysis works. Depends on your definition of “works” and what you are using technicals for.

Technical analysis has zero predictive value, zero. Example: Trend trading. If trend trading worked as taught using technical analysis we would all be multimillionaires many times over. How many millionaires are on this board that made their money trading technical analysis? This place is, and has been for many years, overwhelmingly full of struggling and failed technical traders, an awful lot of people that eventually, slowly, faded away from trading. Where is the edge? Look at the statistics not the hype.

Technical Analysis does work well for money management.
Unfortunately it makes sense, but it is like without technical analysis there is something missing in trading.
And what do you mean by it working well for money management?
 
Technicals can be useful in determining where to enter a trade. Useful in determining if you should take partial profits, completely exit a trade or add additional positions. Technicals are also helpful in determining your stops. Money management stuff.

You should do your research to determine what trades you are going to take without using technicals. Since technicals have no predictive value, technicals should not be used to decide what trade to take. Once you decide to take a trade then technicals can be useful in the management of that trade.
Thanks for taking your time to explain
 
Hello Imogen

I happened to see your post and thought this might help you
with some reservations as follows

1) I have no business connection to "TraderDale". I was in contact with him
long ago, but have not spoken to him since. He has a reasonably good understanding
of how trading works
2) He does sell products that include indicators. Interestingly he (in the attached video)
suggests that indicators don't work. We agree on that
3) I was trained by an institutional trader long ago. He taught me a basic system
gave me a couple of tools based on volume, and let me watch as he traded his own account
4) I was a slow learner. Now years later I think I have a sense of what it takes to create a sustainable
business trading. When my mentor passed on recently, he asked me to "Pay It Forward" by
showing "a few" others how to trade. That is why I am posting.
5) I created a thread entitled "A professional approach to trading" If you decide to look at it
I suggest you only look at the most recent posts, since they show what I intend to present
to help traders struggling to make profit in this difficult business.

In response to my mentor's request I developed a simplified method just for Retail traders
I have been testing it and it seems to work quite well. In the coming days I will present a
LiveStream on Twitch and YouTube, that struggling traders might find useful. I will post on
my thread when that is about to go live.

Here is the Internet Link to a video from TraderDale, in case you would like to listen to what he
has to say, not only about indicators, but how he would proceed if he were to "start over today"
I use Volume Profile, but not in the same way that he does. His approach is known as "Swing
Trading" and requires a longer time frame approach. I trade the New York Session of the S&P
500 Futures on a daily basis (I am a daytrader).


I wish you the best of luck in all that you do

Steven
 
Last edited:
I was wondering if most traders are looking at the same charts, levels, and indicators, wouldn’t their actions cancel each other out? Technical analysis works because people believe in it, but if everyone believes the same thing, does it still provide an edge
If everyone uses the same indicators or levels the same way, any simple edge tends to disappear because markets price in those behaviors. But the reality is, people interpret signals differently, use different timeframes, risk tolerances, and parameter settings.
So while technical analysis itself isn’t an edge, how it’s applied can be. The edge comes from context, combining indicators, timing, volatility filters, adapting to changing market conditions, and managing risk better than others who use the same tools in a static way.
 
Hello Imogen

I happened to see your post and thought this might help you
with some reservations as follows

1) I have no business connection to "TraderDale". I was in contact with him
long ago, but have not spoken to him since. He has a reasonably good understanding
of how trading works
2) He does sell products that include indicators. Interestingly he (in the attached video)
suggests that indicators don't work. We agree on that
3) I was trained by an institutional trader long ago. He taught me a basic system
gave me a couple of tools based on volume, and let me watch as he traded his own account
4) I was a slow learner. Now years later I think I have a sense of what it takes to create a sustainable
business trading. When my mentor passed on recently, he asked me to "Pay It Forward" by
showing "a few" others how to trade. That is why I am posting.
5) I created a thread entitled "A professional approach to trading" If you decide to look at it
I suggest you only look at the most recent posts, since they show what I intend to present
to help traders struggling to make profit in this difficult business.

In response to my mentor's request I developed a simplified method just for Retail traders
I have been testing it and it seems to work quite well. In the coming days I will present a
LiveStream on Twitch and YouTube, that struggling traders might find useful. I will post on
my thread when that is about to go live.

Here is the Internet Link to a video from TraderDale, in case you would like to listen to what he
has to say, not only about indicators, but how he would proceed if he were to "start over today"
I use Volume Profile, but not in the same way that he does. His approach is known as "Swing
Trading" and requires a longer time frame approach. I trade the New York Session of the S&P
500 Futures on a daily basis (I am a daytrader).


I wish you the best of luck in all that you do

Steven
I am also learning. Thanks for the suggestion.
I'll check it.
 
If everyone uses the same indicators or levels the same way, any simple edge tends to disappear because markets price in those behaviors. But the reality is, people interpret signals differently, use different timeframes, risk tolerances, and parameter settings.
So while technical analysis itself isn’t an edge, how it’s applied can be. The edge comes from context, combining indicators, timing, volatility filters, adapting to changing market conditions, and managing risk better than others who use the same tools in a static way.
Nice explanation! But could you tell me how using different timeframes can result in the market behaving differently while everyone is basically making decisions based on what the indicators are showing?!
 
Nice explanation! But could you tell me how using different timeframes can result in the market behaving differently while everyone is basically making decisions based on what the indicators are showing?!
First, I am hopeful that some of my commentary may help you. I have been trading for about 17 years so
I think I may have a handle on how it all works

As regards time frames. It may help to consider the following context

The markets are dominated by a small group of institutions. They manage money given to them by the Top 1%
worldwide. They are also listed on the Exchanges, meaning that they have to report their activities publicly on
a quarterly basis. People who choose this method of managing money are known as "Other Time Frame Participants".
While these persons do consider "Technical Analysis", they also use "Fundamental Analysis", AND in some instances
they also include analysis of political influences (this is happening now in the US) that could affect how business is
conducted, and ultimately WHO will make (or lose) money. As you are beginning to see, technical analysis is a subset
of a larger system. I include all of it in my weekly analysis and if you are interested in learning more, you are welcome
to listen in when I create my trading plans during the weekend (Saturdays). It might be that you can learn something
that can be applied to the trading that you are doing.


Good luck to you
 
Last edited:
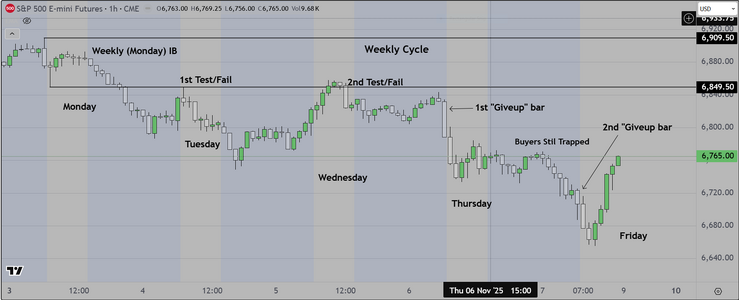
Here is a chart, part of my weekly "Markup" series
that my help to brings things into focus

This chart uses hourly (60 minute) candles, and shows price action starting on Monday
extending to Friday. What I would point out to you, is that the range from high to low on
Monday (also known as the "IB" or Initial Balance") was tested and failed to move above that
range twice, and after that, on successive days, price created what professionals call "Giveup"
bars. These bars are signals (to observant professionals) that this market was headed lower,
Thursday and again on Friday.

My point is that another element of analysis is Behavioral. People exhibit patterns of behavior that
can be observed for example. If the market tries twice unsuccessfully, to move higher, one can bet
that it is then going to move lower or sideways. There is a kind of symmetry that is often exhibited
by other professionals, and you will see it in the algorithms they create to buy and sell.

Hope this opens your eyes to new possibilities

Good luck
 

Attachments

  • Weekly Cycle.PNG
    Weekly Cycle.PNG
    97 KB · Views: 17
Hi Steven,

I am going to keep this simple for the benefit of the other posters. I am sure you know this already.

I interpret this chart a little differently. In the end both Steven and I seem to be in agreement.

Monday, Tuesday and Wednesday I see a ranging market. Buying and selling as it should be.

Tuesday there is a move down. Often, not always, Tuesday provides an indication of the direction of the market for the week. In this case Tuesday’s move seems to correlate with how the market moved. The overall downward trend Wednesday, Thursday and is Friday is visible. Friday ended lower for the week. The chart Steven posted is a nice example of this. An indication to watch for, but not something I would trade solely based Tuesday’s direction.

On Thursday the buying and selling in the range ceased with price going sharply lower. I don’t know what the cause of this was from looking at the chart. Could be anything. Steven’s assessment of buyers being trapped is a very important observation.

To further explain this, you will have traders in long positions. The sudden sharp move down traps them in those long positions. They did not have time to get out. The moved happened too fast. Now they are stuck in those long positions not being able to get out without taking a nice loss. So they will sit in those positions without exiting in the hopes the market will go higher. Trapped traders can at times set up a very nice trading opportunity.

Thursday into Friday there was profit taking. So when you are in a short position, to exit your trade, to take profit, you need to buy. You will see on Friday that all the profit taking, exiting the short trades, caused in an increase in buy orders. All these buy orders resulted in the move higher on Friday. Traders exiting their short positions before the market closes for the weekend.
 
Sir or Madam

While I appreciate your interpretation, and it is generally correct, there are a couple of things
to consider as follows

1) As regards the comment about participants not "having time to get out", on the institutional side
this is incorrect. The computers that monitor price action have a significant advantage as regards
processing speed. They can (and do) identify which side is in control before live participants can,
by looking for specific order flow patterns ("Stack & Pull" for example). While that may be of interest
to some it is not useful, because human traders simply don't have an edge here. It is simpler
(and faster) for human traders to recognize and react to price behavior.

2) Also it is important to keep in mind that institutional programs are managing position sizes
that are significant. They don't concern themselves with the relatively minor price swings shown
on weekly or intraday charts. They will often simply scale in higher or lower, or hedge in other markets.

3) As a practical issue, what is more valuable to Retail traders is to learn how to recognize (on shorter
time frames, 1) Which side is in control, and 2) To accurately identify "Leg Count" (generally retail traders
want to enter at "Leg 2" and hold).

Final Thought

Based on a survey of the content on this and other sites, it seems clear that Retail traders are unaware
of these concepts and those of you who actually have money are putting it at risk using systems that
don't have an edge. The result is inevitable and is (probably) why there is so little interest and engagement
It's as though someone were posting in a different language.

For those who might have an interest in actually making money at this, you may want to visit, when I go live
with my pre-market analysis.
 
Last edited:
As regards the comment about participants not "having time to get out", on the institutional side
this is incorrect. The computers that monitor price action have a significant advantage as regards
processing speed.
Agreed. So from the institution perspective you are coming from, who are the trapped traders you pointed out on the chart and how did they become trapped? Trapped traders are easily explainable from a retail perspective.

As a practical issue, what is more valuable to Retail traders is to learn how to recognize (on shorter
time frames, 1) Which side is in control, and 2) To accurately identify "Leg Count" (generally retail traders
want to enter at "Leg 2" and hold).
On the lower timeframes like the 5 minute, price appears to be much more random. The algorithms to some degree control price in the short term. Algorithms have less influence on price on the higher timeframes due to larger order flows. Why are you teaching retail traders on the most difficult, most manipulated timeframes to trade? To me, keeping traders on the higher timeframes, at least until they get good at trading, seems like it would be more productive.
 
Understandable questions

First of all, in the professional realm it is not "trapped traders" but trapped volume ("trapped buy or sell volume"
that is almost entirely algorithmic not live participants).

and after that one has to realize that the institutions on both sides of the market, do not concern themselves
(as mentioned previously) because they know they can scale in higher or lower and/or hedge in other markets
They (institutions) have sufficient funds to manage these strategies (it's other peoples money after all) AND
they know that in time, the market will likely revisit the areas in which that volume was "trapped", at which point
they will exit at either breakeven or with a profit based on the scale ins along the way.

As to choice of time frame in which to operate, on the higher time frame all the participants are managing either
fund (retirement) or speculative money, and that means amounts in excess of several hundred millions of USD daily.
Personally I do not have that kind of speculative money available to me, nor do I want to accept that risk. so
I trade in the arena where I can make money consistently while accepting less risk.

Finally as regards whether price "looks random" on a 5 minute basis. Be advised that institutions want you to
have that impression. Chaos theory says otherwise, AND we prove on a day to day basis, that there are tradable
patterns that can be exploited, whether by time segment or by price behavior (in prior posts we pointed out that
there are 4-5 reliable time segments that can be traded, provided the operator has the skills).

Good Luck

Postscript

On my other thread "A Professional Approach..... I posted both the overnight (from my perspective) and a trade
from the NY open, based on price behavior after the IB (Initial Balance).
 
Last edited:
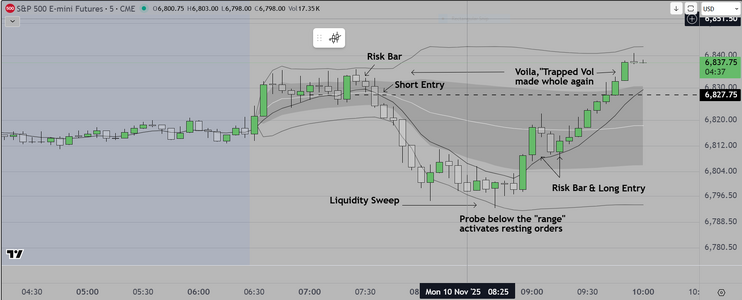
Here is another perspective as regards the 5 minute time frame

Again, institutions have little or no concern as they are willing to scale in above and below
current price knowing that the odds favor a reversal at some point, either during the current
session or at some point afterward.

If there is any "secret" to this it is how to identify and manage risk. Most traders spend their
time trying to find indicators and setups. In truth what makes a difference is whether a trader
can learn how manage risk and exit at or near to the optimal price. Remarkable that most folks
are looking in the wrong places

Good luck
 

Attachments

  • Today's Example.PNG
    Today's Example.PNG
    110.7 KB · Views: 13
First, I am hopeful that some of my commentary may help you. I have been trading for about 17 years so
I think I may have a handle on how it all works

As regards time frames. It may help to consider the following context

The markets are dominated by a small group of institutions. They manage money given to them by the Top 1%
worldwide. They are also listed on the Exchanges, meaning that they have to report their activities publicly on
a quarterly basis. People who choose this method of managing money are known as "Other Time Frame Participants".
While these persons do consider "Technical Analysis", they also use "Fundamental Analysis", AND in some instances
they also include analysis of political influences (this is happening now in the US) that could affect how business is
conducted, and ultimately WHO will make (or lose) money. As you are beginning to see, technical analysis is a subset
of a larger system. I include all of it in my weekly analysis and if you are interested in learning more, you are welcome
to listen in when I create my trading plans during the weekend (Saturdays). It might be that you can learn something
that can be applied to the trading that you are doing.


Good luck to you
Good to know that.
Where can I find your analyses?
 
Back
Top