Trend analysis is a complex process that goes beyond trend lines, channel lines and retracements. An important aspect of this type of analysis is the identification of patterns that reinforce trends and of formations that signal the reversal of trends.
Chart formations that show the extension of trends are called continuation patterns. They consist of pauses within trends and they are generated by traders who realize some or all of their profit typically ahead of significant releases of economic data or strong technical level. These behavioral patterns translate into chart formations and tend to look like neutral moves. However, they can either slope against the original trend or, more rarely, slope in the direction of the trend. The consolidations are fairly short - but not always.
The most important continuation patterns are: flags, pennants, triangles and wedges. Let's focus on triangles.
Differences between a Pennant and a Triangle
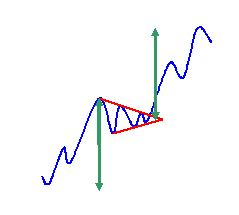
A pennant is trend continuation formation which consists of a trend, also known as the pennant pole, a consolidation formation, which resembles a triangle, and of a breakout in the same direction of the original trend (see Figure 1). Back testing shows that the breakout is similar in size to the amplitude of the original trend. While lack of volume continues to haunt FX traders, it is easy to see that volume decreases steadily as the consolidation phase of the pennant is unfolding. This raises the issue of the direction of the breakout; while a bull pennant is supposed to break upward and a bear pennant to continue downward, the consolidation shows clearly the dwindling trading interest, and this warns of possible fake breakouts.
Figure 1. Diagram of a pennant.
Triangles can be envisioned simply as pennants with no poles (see Figure 2). This means that you will have price objectives smaller than the pennants'.
Figure 2. Diagram of a triangle.
Types of Triangles
There are four types of triangles: symmetrical, ascending, descending and expanding (broadening). The most common, by far, is the symmetrical triangle (see Figure 3).
A symmetrical triangle is bordered by symmetrically converging support and resistance lines. The price target of a triangle can be measured in two ways: by extrapolating the width of the base of the triangle from the breakout point, or by drawing a parallel to the support line in the case of bullish triangle (or to the resistance line for a bearish triangle). These two methods may lead to slightly different price targets.
Figure 3. Two methods of measuring the price objective for a symmetrical triangle.
Let's follow the numerical example in Figure 4. The width of the triangle is the 150 pip-range between 1.2850 and 1.2700. Once the currency market breaks out at 1.2775, apply the first method and extrapolate 150 pips always from the breakout point; you will have a price target of 1.2925. If you apply the second method, then the dotted line, which is a parallel to the rising support line, will yield roughly the same target as the first method.
Figure 4. Numerical example of calculating the price objectives of a triangle.
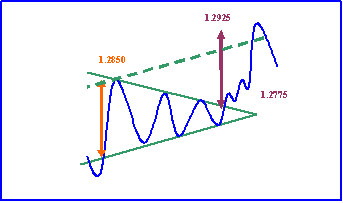
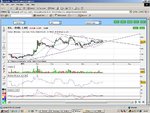
Figure 5 displays a market example of a symmetrical triangle on the daily dollar/yen chart. The consolidation period lasted approximately 8 ½ months, so this qualifies is as a medium-term or even longy-term formation. This is a typical example for this pattern because, unlike flags or pennants, it works best in the medium term or the long term.
Figure 5. A market example of a symmetrical triangle on the daily dollar/yen chart.
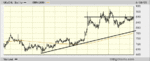
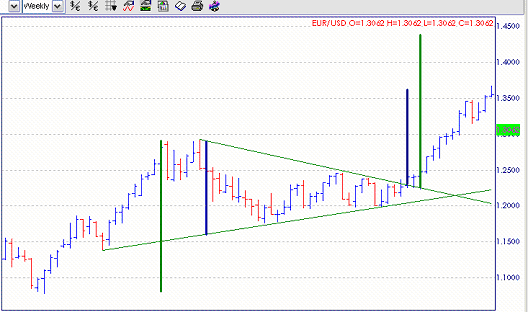
Let's take another example in which the type of formation unfurling is less clear. Figure 6 displays a triangle in the euro/dollar weekly chart. The base of the triangle is marked by the blue line on the left of the chart and measures approximately 1275 pips. Euro/dollar broke upward from 1.2265; if you extrapolate the 1275-pip distance, you will calculate the objective of the triangle at 1.3540. This target was reached. However, is this only a symmetrical triangle or is it only the "canvas" part of a bullish pennant? Well, it looks like one, so it's normal to say that it's a bullish pennant. The problem here is that the target of the pennant is so enormous that might exceed normal expectations. In this case, the length of the pole of the pennant is approximately 2100 pips - quite a hefty size. Measuring this distance from the breakout point will generate a target for the euro/dollar at 1.4365! To reach such a distant objective, the pair must surpass the standing life-time high in the 1.3666 area and coin an all new record; this is easier said than done. Consequently, the medium term currency traders are advised to shoot for the initial target, which comes from the triangle, and take profit on some of the long positions. The profit on the rest of the long position should be taken following the break of a trendline, short-term moving average or parabolic system. Depending on traders' horizon, entering a short position would probably be a good idea as well. In this example, liquidating long euro/dollar positions and getting short was certainly the best strategy to follow.
Figure 6. A market example of a bullish symmetrical triangle or of a bullish pennant on the weekly euro/dollar chart.
Problem in Reaching the Target of a Triangle
Even the target of a triangle might be too far to be reached. Traders make a big deal out of the breakout from a triangle. However, a breakout can be deceptive for the eye and disruptive for traders' pockets. As the currency is approaching the tip of the triangle, or to be more specific, the area where the slanted support and resistance levels are about to converge, there is no other path to follow but to break out. A break-out from a triangle doesn't guarantee that the currency will reach the price objective of a triangle.
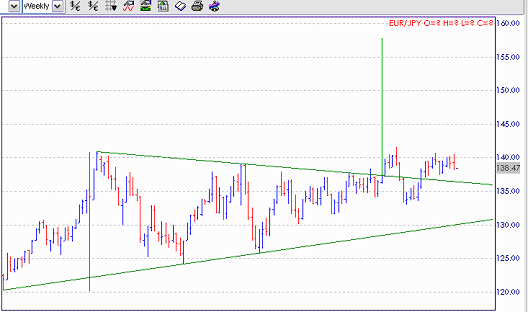
For example, the euro/yen cross formed a triangle on the weekly chart, and the base of this consolidation measures 2100 pips, as the approximate distance between the 141.00 and 120.00 areas. The target of this triangle, which you can see in Figure 7, as measured from the break out point at 137.00 is seen at around 158.00 yen per euro! This is simply too far!
Figure 7. An example of triangle where the target is likely too far to be reached in the medium of the long term.
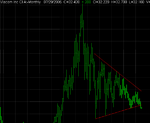
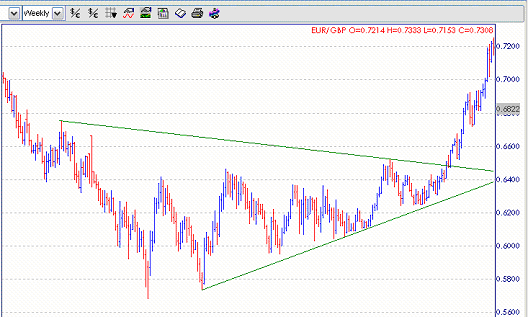
Naturally, in the case of a triangle, the breakout must occur in the same direction as the previous trend to meet the criteria of a continuation formation. The directional risk here comes from the fact that trading volume will visibly decrease towards the tip of the triangle, reflecting the ambivalence in the market or a temporary balance between the supply and demand. This milieu increases the odds that a break will occur on either side, rather toward the "prescribed" direction. An example of a bearish triangle that broke on the wrong side is seen in the weekly chart in euro/sterling in Figure 8.
Figure 8. A market example of a bearish triangle that broke on the wrong side on the weekly chart in euro/sterling.
Regardless of direction, the breakout must be accompanied by a rise in volume, which, of course remains a challenge for the cash currency traders.
Other Types of Triangles
Beside the more common symmetrical triangles, there several other types of triangles.
The ascending triangle is bordered by a flat resistance line and a rising support line. There are two types of ascending triangles: bullish and bearish.
Figure 9. Diagram of a bullish ascending triangle.
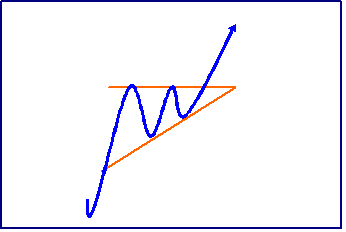
As you can see in Figure 9, the bullish ascending triangle extends an uptrend.
The bearish ascending triangle continues a downtrend and is also formed by a flat resistance line and a rising support line (see Figure 10).
Figure 10. Diagram of typical bearish ascending triangle.
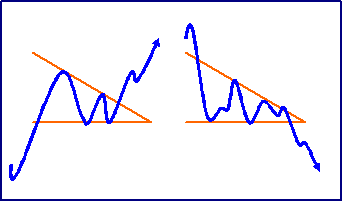
Descending triangles are the mirror image of ascending triangles and are characterized by a flat support line and a declining resistance line. This continuation pattern may be bullish or bearish as well. Figure 12 shows diagrams of both bullish and bearish ascending triangles.
Figure 11. Diagrams of both bullish and bearish ascending triangles.
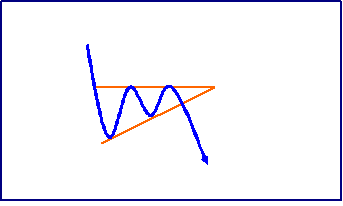
The expanding or broadening triangles are unusual patterns. They consist of a horizontal mirror image of symmetrical triangles, where the tip of the triangle is next to the original trend, rather than its base (see Figure 12). Volume follows the horizontal mirror image switch as well and increases steadily as the chart formation develops.
Figure 12. Diagram of the expanding or broadening triangle.
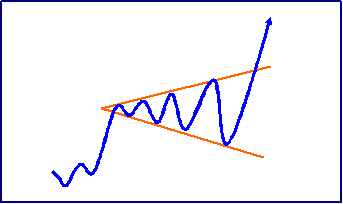
Chart formations that show the extension of trends are called continuation patterns. They consist of pauses within trends and they are generated by traders who realize some or all of their profit typically ahead of significant releases of economic data or strong technical level. These behavioral patterns translate into chart formations and tend to look like neutral moves. However, they can either slope against the original trend or, more rarely, slope in the direction of the trend. The consolidations are fairly short - but not always.
The most important continuation patterns are: flags, pennants, triangles and wedges. Let's focus on triangles.
Differences between a Pennant and a Triangle
A pennant is trend continuation formation which consists of a trend, also known as the pennant pole, a consolidation formation, which resembles a triangle, and of a breakout in the same direction of the original trend (see Figure 1). Back testing shows that the breakout is similar in size to the amplitude of the original trend. While lack of volume continues to haunt FX traders, it is easy to see that volume decreases steadily as the consolidation phase of the pennant is unfolding. This raises the issue of the direction of the breakout; while a bull pennant is supposed to break upward and a bear pennant to continue downward, the consolidation shows clearly the dwindling trading interest, and this warns of possible fake breakouts.
Figure 1. Diagram of a pennant.
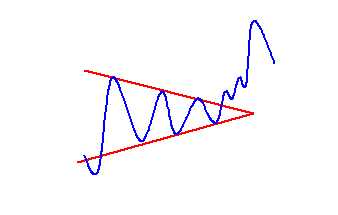
Triangles can be envisioned simply as pennants with no poles (see Figure 2). This means that you will have price objectives smaller than the pennants'.
Figure 2. Diagram of a triangle.
Types of Triangles
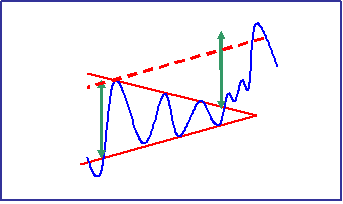
There are four types of triangles: symmetrical, ascending, descending and expanding (broadening). The most common, by far, is the symmetrical triangle (see Figure 3).
A symmetrical triangle is bordered by symmetrically converging support and resistance lines. The price target of a triangle can be measured in two ways: by extrapolating the width of the base of the triangle from the breakout point, or by drawing a parallel to the support line in the case of bullish triangle (or to the resistance line for a bearish triangle). These two methods may lead to slightly different price targets.
Figure 3. Two methods of measuring the price objective for a symmetrical triangle.
Let's follow the numerical example in Figure 4. The width of the triangle is the 150 pip-range between 1.2850 and 1.2700. Once the currency market breaks out at 1.2775, apply the first method and extrapolate 150 pips always from the breakout point; you will have a price target of 1.2925. If you apply the second method, then the dotted line, which is a parallel to the rising support line, will yield roughly the same target as the first method.
Figure 4. Numerical example of calculating the price objectives of a triangle.
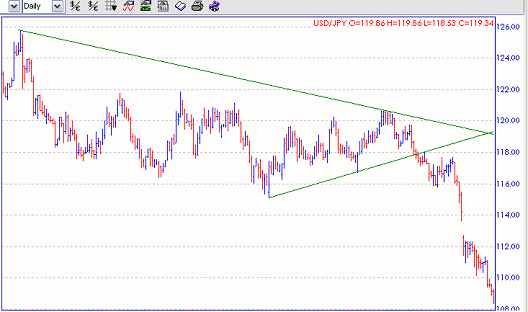
Figure 5 displays a market example of a symmetrical triangle on the daily dollar/yen chart. The consolidation period lasted approximately 8 ½ months, so this qualifies is as a medium-term or even longy-term formation. This is a typical example for this pattern because, unlike flags or pennants, it works best in the medium term or the long term.
Figure 5. A market example of a symmetrical triangle on the daily dollar/yen chart.
Let's take another example in which the type of formation unfurling is less clear. Figure 6 displays a triangle in the euro/dollar weekly chart. The base of the triangle is marked by the blue line on the left of the chart and measures approximately 1275 pips. Euro/dollar broke upward from 1.2265; if you extrapolate the 1275-pip distance, you will calculate the objective of the triangle at 1.3540. This target was reached. However, is this only a symmetrical triangle or is it only the "canvas" part of a bullish pennant? Well, it looks like one, so it's normal to say that it's a bullish pennant. The problem here is that the target of the pennant is so enormous that might exceed normal expectations. In this case, the length of the pole of the pennant is approximately 2100 pips - quite a hefty size. Measuring this distance from the breakout point will generate a target for the euro/dollar at 1.4365! To reach such a distant objective, the pair must surpass the standing life-time high in the 1.3666 area and coin an all new record; this is easier said than done. Consequently, the medium term currency traders are advised to shoot for the initial target, which comes from the triangle, and take profit on some of the long positions. The profit on the rest of the long position should be taken following the break of a trendline, short-term moving average or parabolic system. Depending on traders' horizon, entering a short position would probably be a good idea as well. In this example, liquidating long euro/dollar positions and getting short was certainly the best strategy to follow.
Figure 6. A market example of a bullish symmetrical triangle or of a bullish pennant on the weekly euro/dollar chart.
Problem in Reaching the Target of a Triangle
Even the target of a triangle might be too far to be reached. Traders make a big deal out of the breakout from a triangle. However, a breakout can be deceptive for the eye and disruptive for traders' pockets. As the currency is approaching the tip of the triangle, or to be more specific, the area where the slanted support and resistance levels are about to converge, there is no other path to follow but to break out. A break-out from a triangle doesn't guarantee that the currency will reach the price objective of a triangle.
For example, the euro/yen cross formed a triangle on the weekly chart, and the base of this consolidation measures 2100 pips, as the approximate distance between the 141.00 and 120.00 areas. The target of this triangle, which you can see in Figure 7, as measured from the break out point at 137.00 is seen at around 158.00 yen per euro! This is simply too far!
Figure 7. An example of triangle where the target is likely too far to be reached in the medium of the long term.
Naturally, in the case of a triangle, the breakout must occur in the same direction as the previous trend to meet the criteria of a continuation formation. The directional risk here comes from the fact that trading volume will visibly decrease towards the tip of the triangle, reflecting the ambivalence in the market or a temporary balance between the supply and demand. This milieu increases the odds that a break will occur on either side, rather toward the "prescribed" direction. An example of a bearish triangle that broke on the wrong side is seen in the weekly chart in euro/sterling in Figure 8.
Figure 8. A market example of a bearish triangle that broke on the wrong side on the weekly chart in euro/sterling.
Regardless of direction, the breakout must be accompanied by a rise in volume, which, of course remains a challenge for the cash currency traders.
Other Types of Triangles
Beside the more common symmetrical triangles, there several other types of triangles.
The ascending triangle is bordered by a flat resistance line and a rising support line. There are two types of ascending triangles: bullish and bearish.
Figure 9. Diagram of a bullish ascending triangle.
As you can see in Figure 9, the bullish ascending triangle extends an uptrend.
The bearish ascending triangle continues a downtrend and is also formed by a flat resistance line and a rising support line (see Figure 10).
Figure 10. Diagram of typical bearish ascending triangle.
Descending triangles are the mirror image of ascending triangles and are characterized by a flat support line and a declining resistance line. This continuation pattern may be bullish or bearish as well. Figure 12 shows diagrams of both bullish and bearish ascending triangles.
Figure 11. Diagrams of both bullish and bearish ascending triangles.
The expanding or broadening triangles are unusual patterns. They consist of a horizontal mirror image of symmetrical triangles, where the tip of the triangle is next to the original trend, rather than its base (see Figure 12). Volume follows the horizontal mirror image switch as well and increases steadily as the chart formation develops.
Figure 12. Diagram of the expanding or broadening triangle.
Last edited by a moderator: