I'm making original indicator.
But I don't know how to make line invisible.
I plot SetPlotWidth(1 , 0), but line does not disappear:-0
If you know how to, please teach me!!:help:
Why do you want an indicator that does not plot anything ? Are you wanting it to plot some of the time and not others ? Anyway you can use something like this:
I'm making original indicator.
But I don't know how to make line invisible.
I plot SetPlotWidth(1 , 0), but line does not disappear:-0
If you know how to, please teach me!!:help:
As Trader333 said, it is difficult to advise without knowing the circumstances behind your wish to make a line invisible.
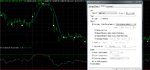
Sometimes you have several plots in a window and you might want to hide some. If this is what you wanted to do then click on the plot or indicator and then use right click. Choose format and go to the scaling tab. Here you can make certain plots hidden (click on subgraph). In the example shown, if I hide the first plot you will only see the RSI on its own.