How to interpret big volume MoC orders

jacknapier

Active member
Messages
157
Likes
2
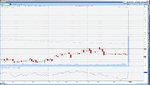
I've noticed every now and again that there is a huge spike in volatility and volume in the last minute of trading. I've attached an image of what I mean. Hollow candles are upticks. (In case that wasn't obvious.) To me, this particular example looks bullish because it looks like a large volume of traders wanted to get in no matter what the price.

I'm wondering if anyone has any thoughts on how to interpret this? Not all of them appear bearish, but I don't have an example on hand.
 

Attachments

  • swks.jpg
    swks.jpg
    458.8 KB · Views: 351
You may see volume spikes at the market open and you may see volume spikes at the market close. While volume looks big it could be normal volume for this part of the day.

Because of that I prefer looking at modulated (normalized) volume. See
2012_10_01_swsk.png
chart below
 
I prefer looking at modulated (normalized) volume.

Well, it's hard to tell, because I zoomed in on my chart so much, but the dotted lines represent set time periods depending on how fast trades are coming in. High volume stocks will have 5 minute separators, really low volume stocks, will only have one or two candles and PM/AH. I don't really see much of a point to look at time based charts, unless they are set to one day or bigger, just to get the big picture. Unless your system is based off of candles.

Large volume bars means that there are large orders per tick(I think? I remember reading that somewhere). That's why I believed them to be a large fund with an algorithm automated MoC orders. Possibly based on some oversold stochastics bounce? 5 days later the symbol spiked more than 2 points above that order(s). 10/5 AM shows a distribution simtri. I don't think it's possible to differentiate a large order(hedge funds) from just a lot of little orders(retail) with time based charts. Maybe I'm wrong here? I don't know, that's just my own newbish observation.
 
Top