You are using an out of date browser. It may not display this or other websites correctly.
You should upgrade or use an alternative browser.
You should upgrade or use an alternative browser.
TheBramble
Legendary member
- Messages
- 8,394
- Likes
- 1,171
If by the Zero/Nuetral line you mean the signal line then the standard MACD is calculated by subtracting the value of a (26-period) EMA from a (12-period) EMA.
A 9-period EMA (the signal line [zero line?]) is overlaid.
The most general signal interpretation is that when the MACD falls below its signal line - it's Bearish; when the MACD rises above its signal line - it's Bullish.
A 9-period EMA (the signal line [zero line?]) is overlaid.
The most general signal interpretation is that when the MACD falls below its signal line - it's Bearish; when the MACD rises above its signal line - it's Bullish.
FetteredChinos
Veteren member
- Messages
- 3,897
- Likes
- 40
not a lot of significance in my opinion. if you work it through, the Zero line is where both the 12 EMA and 26 EMA (or whatever your settings are) are the same value. so basically a cross by the MACD of the zero line just shows that the two EMA's themselves have crossed. and we all know generally how useless they can be.
MACD is fairly reliable when it crosses its signal line at an extreme value, but then again it has been a while since i used it.
I think Bonsai uses his MACD as one of his signals. ie a lower high, or higher low could signify a trend change.
hope these witterings help
FC
🙂
MACD is fairly reliable when it crosses its signal line at an extreme value, but then again it has been a while since i used it.
I think Bonsai uses his MACD as one of his signals. ie a lower high, or higher low could signify a trend change.
hope these witterings help
FC
🙂
jonnyy40
Experienced member
- Messages
- 1,329
- Likes
- 11
I don't know to be honest!
I've got Sierra and what I've got is the macd line,the signal line and a (NEUTRAL/ZERO) line about which the macd difference histogram is laid out.
The macd or slow line is the difference between two exponentially smoothed ma's of closing prices and the signal is an exponentially smoothed average of the macd line.
So as you would expect you get a 'twin ghost' image of the price chart above.
-- Orientated to fit the chart region in which you've chosen to set it --
How is this orientation achieved? The (neutral/zero) line appears to be 'roughly in the middle'.I'd like a simple explanation of how it's set out like it is so I can decide what significance (if any) I should give to the macd/signal lines being above/below the line.
Only just seen your posts so thanks for you replies.
One Eyed Shark
Well-known member
- Messages
- 257
- Likes
- 13
J40
Take a look at this link which should answer all your questions
http://www.stockcharts.com/education/IndicatorAnalysis/indic_MACD1.html
Take a look at this link which should answer all your questions
http://www.stockcharts.com/education/IndicatorAnalysis/indic_MACD1.html
It's a difference of EMAs, as stated earlier by FC. Each MACD value is the difference between the two MA's used, eg 12 and 26 day EMAs... simply subtract one from the other. The signal line is the result of making another EMA up from the series of MACD values for each day, ie an EMA of the differences. MACD going from below zero through zero just means the faster EMA has turned up and gone through the slower - a 'golden cross' (bullish) of the EMAs as many would call that. So the MACD going from below zero to above shows recent price action is trending upward, the slower 26 day ema (assuming 'standard' values) is lagging.
Generally speaking a MACD rising below zero, that is overtaken by its signal line rising through it, will reflect a price chart where recent rises are accelerating - the chart might still look bearish, but the drop is bottoming out. MACD below zero but climbing = short term MA rising above longer, bullish. MACD below zero falling = short term falling faster than long, bear doldrums. MACD above zero climbing = short term accelerating faster than longer, both look bullish, so you are getting into the bull phase a little later than in the 'MACD below zero, climbing' case, and MACD above zero and falling is long term MA is really starting to catch short term up, uptrend is running out of steam.
Dave
GruntnoWay
Active member
- Messages
- 159
- Likes
- 2
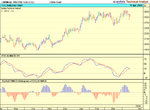
I have started using the Macd histogram which takes the difference between the Macd and the moving average. It makes it a whole lot clearer. When the moving average and the Macd cross each other the histogram crosses zero. I have shown both so you can see.
Attachments
I use MACD in combination with chart patterns and other signals. The best use of MACD for me is divergence (providing there's no consolidation between peaks). Then I like rising above zero or falling below zero.
However, I'm more careful with a cross above or below the zero line. I think the EMA's return to the zero line as a matter of course. If it's a sharp turn I treat it as a good sign but wouldn't use it to trade without other signals. If it's a slow turn I ignore it.
However, I'm more careful with a cross above or below the zero line. I think the EMA's return to the zero line as a matter of course. If it's a sharp turn I treat it as a good sign but wouldn't use it to trade without other signals. If it's a slow turn I ignore it.
Hi jonnyy
someone mentioned my name in connection with MACD so I thought I should add a few notes for you.
first, I dont subtract one MA from another.
I discarded that approach a long time ago.
I divide one MA by the other.
so A/B-1 is the formula.
and I also stopped using a signal line some time ago.
You can use any length of MA. It would be foolish to think that the same length of MA will work for different stocks at different times. You only have to have a minor appreciation of Elliott to know what I mean.
The zero line seems to have 2 roles that you might like to think about
1- it is often used as a signal in itself. A break up through zero would trigger a long (I think this has more value in position trading).
2- After a fall to oversold levels a pull back to zero can often catch a failure of that rally. So a fail to break zero would be a short
I take higher lows (after oversold) very seriously if the stock is in an uptrend.
Lower highs (after overbought) carry the same sort of weight.
Otherwise, I am wary of divergences.
Hope this all helps.
GruntnoWay
Active member
- Messages
- 159
- Likes
- 2
bonsai said:
You can use any length of MA. It would be foolish to think that the same length of MA will work for different stocks at different times. You only have to have a minor appreciation of Elliott to know what I mean.
Thats very informative. I have tried optimising macd and it does give completely different moving averages for each share.
jonnyy40..................apropos the whole subject of MACD I have a very interesting book... title : Trading Chaos {BILL WILLIAMS] had this book for a few years and seem to remember it was high on the must reads in the late ninties and particularly was ranked by John Piper of "Way To Trade" fame.
The Book looks at Fractal Signals, Elliot Wave, The Human Brain Left Side/Right Side etc but particularly use of the MACD oscillator as a leading indicator to identify the peak wave 3, end of wave 4, end of trends and top of wave 5............see if you can get hold of a copy of this book.
The Book looks at Fractal Signals, Elliot Wave, The Human Brain Left Side/Right Side etc but particularly use of the MACD oscillator as a leading indicator to identify the peak wave 3, end of wave 4, end of trends and top of wave 5............see if you can get hold of a copy of this book.
Similar threads
- Replies
- 21
- Views
- 11K