Hey folks. I'm trying to learn more about triangle patterns (high to low volatility)
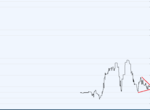
I know that TA says that a triangle will usually break out in the direction of the established trend, but how do I establish the trend in this chart?
Do I consider this a down trend because of the recent price action, or an up trend because there were no lower lows after the ones at the start, and the current price is higher than the starting price?
In other words, should I expect a break up, or down, and why? Or maybe no clear break at all?