NzdCad
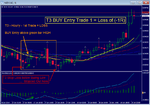
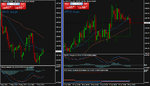
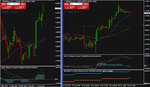
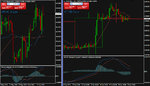
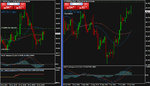
Was looking over the charts this morning, letting my eyes adjust to being able to see setups and seen this on on the NzdCad pair. Daily on the right Hourly on the left.
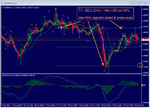
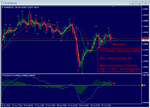
Resumption of the uptrend and MACD FL above 0 and SL on the daily, not to mention the great momentum crossing the diverging MA's at the time.
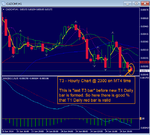
On the hourly, the FL had just turned up, a break of the high by a few pips, for me that few is 5, same with a stop at a swing point, 5 pips. But never placed at a round number. So if it means 7 or 8 pips, so be it, same risk percentage, just means a smaller lot size. Back to the setup candle, a break of the 0500 candle on the 17th by 5 pips would signal an entry. Stop would be placed 5 pips below the recent swing.
One thing to note, if I see a setup that I missed I will enter by market if need be and ONLY IF price has come back to the entry price and the rules for entry ARE STILL VALID but I will NEVER chase a trade, at least not ever again. That's the discipline that I've instilled in myself from being burned too many times. Discipline is not easy to master of yourself, but being former military has helped immensely in that area. And then there's learning to trust your rules and yourself with those rules.
Guess that's enough rambling from me... onto the charts.
WO, if I've missed the mark with this, please shed your professional light on me and the errors of my ways.
K.C.
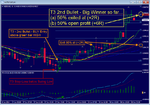
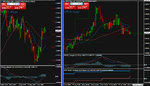
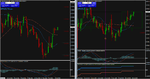
Was looking over the charts this morning, letting my eyes adjust to being able to see setups and seen this on on the NzdCad pair. Daily on the right Hourly on the left.
Resumption of the uptrend and MACD FL above 0 and SL on the daily, not to mention the great momentum crossing the diverging MA's at the time.
On the hourly, the FL had just turned up, a break of the high by a few pips, for me that few is 5, same with a stop at a swing point, 5 pips. But never placed at a round number. So if it means 7 or 8 pips, so be it, same risk percentage, just means a smaller lot size. Back to the setup candle, a break of the 0500 candle on the 17th by 5 pips would signal an entry. Stop would be placed 5 pips below the recent swing.
One thing to note, if I see a setup that I missed I will enter by market if need be and ONLY IF price has come back to the entry price and the rules for entry ARE STILL VALID but I will NEVER chase a trade, at least not ever again. That's the discipline that I've instilled in myself from being burned too many times. Discipline is not easy to master of yourself, but being former military has helped immensely in that area. And then there's learning to trust your rules and yourself with those rules.
Guess that's enough rambling from me... onto the charts.
WO, if I've missed the mark with this, please shed your professional light on me and the errors of my ways.
K.C.
Attachments
Last edited: