Whichever time frame you use, or whichever means of presentation (bars, candles, line, tpo, renko,...), it's only a representation and nothing more. The more I zoom in on a chart, the better I can sense the flow of buying and selling pressure. If one is looking at 30min or hourly bars he isn't going to see what went on in that bar while it formed. On a 2 or 5-min bar/candle, sititng in front of the screen seeing them form in real time gives you a much better indication of what price is doing.
Does your chart gives you a clearer picture? Perhaps for your purpose or your system, but definitely not for mine. If you find charts on smaller timeframe more difficult to read, than it's probably because you think that lower timeframes consist of noise, but you couldn't be more mistaken.
The more you zoom in, the more potential possibilities and opportunities for making money.
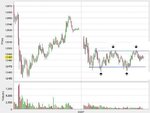
For example: this 5-min chart of the YM of last week shows a relatively small ranging day (price travels between 12465 and 12495). While on a bigger time frame this will look like sideways chop, zooming in to a smaller timeframe shows nice up and downswings. Taking each swing back would have made you 3 times 30 points and more if you shorted on the last arrow to the right of the chart. So about 100 points (per contract) doesn't seem like a bad day to me, while if I am understanding you right, you would have stayed out because it's going nowhere :|