hindenburg omen

sickwake

Newbie
Messages
1
Likes
0
Hey guys,

Just wondering where to find current readings of the hindenburg omen. Studying crashes from the past to see if its an indicator worth keeping. But cant find it on stockcharts, freestockscharts or yahoo. it is a chart indicator right?

Thanks everyone!
 
Hey guys,

Just wondering where to find current readings of the hindenburg omen. Studying crashes from the past to see if its an indicator worth keeping. But cant find it on stockcharts, freestockscharts or yahoo. it is a chart indicator right?

Thanks everyone!

hindenburg omen analyzes 52-week lows and highs of the NYSE Composite. See below that NYSE chart with these data

chart20140421highlows.png


At MarketVolume.com you will be able to scroll high/lows back to 1997 and see how hindenburg omen principles worked for the last crashes
 
hindenburg omen analyzes 52-week lows and highs of the NYSE Composite. See below that NYSE chart with these data

chart20140421highlows.png


At MarketVolume.com you will be able to scroll high/lows back to 1997 and see how hindenburg omen principles worked for the last crashes

vicorka you're not seriously creating nics to then promote your own product are you :LOL::LOL:
 
"sickwake" asked about high lows indicator for NYSE. I posted a chart's snapshot. According to hindenburg omen indicator when both New Highs and New Lows are above 2.2% from the total number of listed stocks then it would be a signal of the potential for a financial market crash.

"sickwake" does not have to subscribe to MarketVolume service to analyze the current high/low data - he can see it on the chart I posted. If he wants to see historical Highs and Lows readings for NYSE, S&P 500 and other indexes, then he can subscribe to MarketVolume or he can ask me and I can post it on this forum.

If you know other charting service that provides history for New Highs and New Lows back to 1997 that Mr "sickwake" can see it you are welcome to share it. if your charting software provides it, you are welcome to share your chart's snapshot.
 
Last edited:
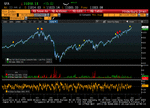
Yellow dot for instance of Hindenburg Omen.
Red diamond when multiple instances within 36-day period.
 

Attachments

  • hind.gif
    hind.gif
    48.3 KB · Views: 270
More accurate? It'll potentially paint a different picture, sure - but I don't know where accuracy comes into this. Will post up one for S&P later.
 
hindenburg omen rule was set in late 1930 - it was 80 years ago. How many stocks were traded on NYSE at that time and how many are listed now? Also we have to keep in mind that there are many ETFs traded on the NYSE as well... I do not think the 2.2% would be correct number. From your own chart you may see that this rule has too many false signals.

I agree with hindenburg's idea - we have certain number of stocks that crashing (hitting 52 week low) but we still have certain number of stocks that are making 52-week high which holds the indexes (market) from a crash. However, if from that point the number of stocks hitting 52-week lows growing than it may start affect indexes trend (market trend). As I mentioned I agree with this idea, however, 2.2% level and NYSE index, I do not think would be the best choice. Check the Hindenburg Omen calcuator
 
Top