Hello everyone,
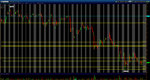
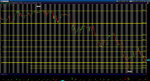
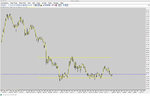
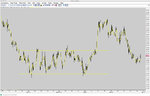
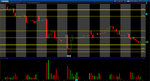
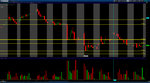
I am in the infant steps with learning technical analysis. I started with trying to recognize Support and Resistance and how to properly draw the lines on the chart. I have been watching videos, webinars and reading on this topic and I am unsure if I am doing this properly. I was hoping the community could take a look at the 2 charts I tried this on and provide me feedback about how I did with finding and drawing S/R.
Did I get it right? Was I close? way off? What the heck did you do you crazy bugger, go back and get more help!!
any input, help or advice is greatly appreciated!
Attachments
Last edited: