Dentalfloss
Legendary member
- Messages
- 63,404
- Likes
- 3,726
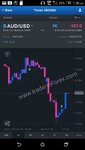
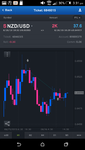
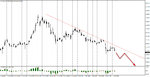
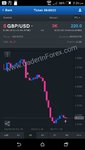
a closer look on 60 min data
the latest upmove
potential support areas marked if it retraces

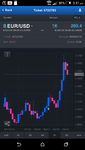
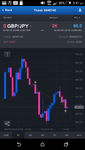
the latest upmove
potential support areas marked if it retraces
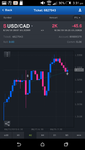
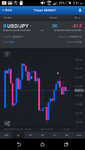
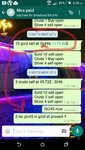
Check where crude sell started. And still holding

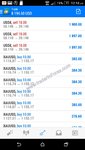
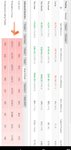
SSI Snapshots show that retail traders have only increased their short positioning as the Speculative Sentiment Index (SSI) now stands at -1.3047 for gold. That means there are now 1.3047 short positions for each long position.


The trading crowd has flipped from net-short to net-long XAU/USD.


Excellent...presently we are in short. In Gold. This ssi is a great parameter for giving trend of the market.


We keep seventy percent of our capital idle. We are idiots to do this.