sujithsstorock
Veteren member
- Messages
- 4,236
- Likes
- 42
please keep posting the ssi updates. we all wuld love to see it.
ssi has a random distrubution , where some mad traders could ver weight it and manipulate the ssi . we have seen some crazy trader do 100 lots and this off set the balance in a wrong manner. we were burned at that instance
please keep posting the ssi updates. we all wuld love to see it.

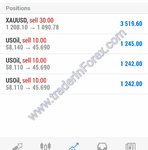
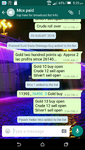
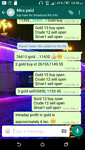
We are holding our sell in crude

We are holding our sell in crude
Hey mate, was wondering where you think the bottom for oil is? I'm in a sell position myself and was thinking it'd be around now, given it's the level it rebounded upon last time at around 4500, but it seems to have broken that. Obviously the demand concerns e.g. china etc still remain and supply is still very high.. so $40?
we are holding it still. honestly when we wentshort at 58$ we didnt expect this. so currently stop is at 49$
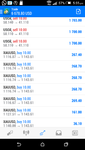
The SSI Snapshots indicator for USOil is at 4.1563, which means there are 4.1563 long positions for every short. In other words, over 80% of FXCM's retail client base are long. Since SSI is a contrarian indicator, that's a strong bearish signal.


Interesting analysis. You're biasing gold to the upside if I interpret you correctly. I guess you're talking from an intraday perspective as in tomorrow (Friday). From late 2013 there's been a diminishing quarterly spike cycle providing opportunities to sell. Diminishing as in the spikes are getting lower and the price heads toward a significant support level at 1k. With 100 points to pay for I don't think I want to sell into that level, but neither do I see any immediate optimism for buying. 'Storage of value versus deflated currencies'? Why would a diminishing commodity price be considered a storage of value. China's markets are still up 70% YoY. FDI is amazingly low so contagion from a dramatic slump is low. And the money being pulled out of a spooked market by domestic mom & pop investors is going into property, which will serve as a greater brake on slippage than and government directed TARP-like intervention. To summarize, China currency devaluation as a result of minor stock revaluation will have little positive impact on gold.Gold enjoyed a wild ride in the previous session which carried on today, as consecutive low renminbi rates pressured other Asian currencies to this year's record lows and threatened widespread currency devaluations. Gold suddenly gained back appetite as a storage of value versus deflated currencies.
Past performance is not necessarily indicative of future results.
Downtrend signal in gold has finished and all eyes are on the upside for now, with a resistance level ahead at 1134.2 and the 38.2% Fibo at 1132.79. Daily momentum seems to peak today after four days of strong gains with prices in higher-high and higher-low fashion. Downside extension is limited and an indicative support level is found at 5-day moving average at 1110.95.


Interesting analysis. You're biasing gold to the upside if I interpret you correctly. I guess you're talking from an intraday perspective as in tomorrow (Friday). From late 2013 there's been a diminishing quarterly spike cycle providing opportunities to sell. Diminishing as in the spikes are getting lower and the price heads toward a significant support level at 1k. With 100 points to pay for I don't think I want to sell into that level, but neither do I see any immediate optimism for buying. 'Storage of value versus deflated currencies'? Why would a diminishing commodity price be considered a storage of value. China's markets are still up 70% YoY. FDI is amazingly low so contagion from a dramatic slump is low. And the money being pulled out of a spooked market by domestic mom & pop investors is going into property, which will serve as a greater brake on slippage than and government directed TARP-like intervention. To summarize, China currency devaluation as a result of minor stock revaluation will have little positive impact on gold.


It remains to been seen whether the current rally can last, but gold is now trading right around key resistance at the 38.2% Fib level of 1132.79 that I identified in my previous post. A daily close above that exposes the 50% level at 1151.79.

It's also worth noting that retail sentiment recently flipped from being net long to being net short gold (XAU/USD). The Speculative Sentiment Index (SSI) is currently -1.0952 for gold, which means there are 1.0952 short positions for every long position.