martin brown
Active member
- Messages
- 144
- Likes
- 2
i am currently looking at calander spreads for gold.
for example, buy the dec '06 contract & sell the oct '06 contact.
however looking at a few charts i am baffled. 😕
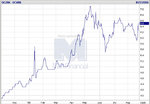
futuresource shows that a daily spread chart is trending up since Dec '05 from $4 to now $6.5.
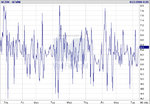
but looking at futuresource's 2 week 60min spread chart shows that the intraday range has been between $4.2 and $8. 😱
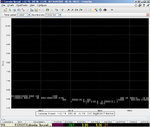
now looking at an Interactive Brokers 1 week 60 min bar chart shows that the spread has not moved at at all from its $5.75-$6.25 range?
what am i missing here?
how could you possibly trade this particular calander spread?
http://www.futuresource.com/charts/charts.jsp?s=GCZ06-GCV06&o=&a=D&z=650x450&d=MEDIUM&b=CANDLE&st=
http://www.futuresource.com/charts/...V06&o=&a=V:60&z=650x450&d=MEDIUM&b=CANDLE&st=
for example, buy the dec '06 contract & sell the oct '06 contact.
however looking at a few charts i am baffled. 😕
futuresource shows that a daily spread chart is trending up since Dec '05 from $4 to now $6.5.
but looking at futuresource's 2 week 60min spread chart shows that the intraday range has been between $4.2 and $8. 😱
now looking at an Interactive Brokers 1 week 60 min bar chart shows that the spread has not moved at at all from its $5.75-$6.25 range?
what am i missing here?
how could you possibly trade this particular calander spread?
http://www.futuresource.com/charts/charts.jsp?s=GCZ06-GCV06&o=&a=D&z=650x450&d=MEDIUM&b=CANDLE&st=
http://www.futuresource.com/charts/...V06&o=&a=V:60&z=650x450&d=MEDIUM&b=CANDLE&st=