You are using an out of date browser. It may not display this or other websites correctly.
You should upgrade or use an alternative browser.
You should upgrade or use an alternative browser.
Getting a Life ... Position Trading the higher Time Frame
Thanks for the idea Ivan- I'd like to share something I have learned about trading:
Trading is extremely difficult. 1% of the traders make 99% of the money. The reason trading is so difficult is because there are 2 ways to lose and only one way to win.
You lose if the trade is a bust from the get go and you lose when a trade comes back and takes your profit away. The only way to win is to be right out of the box.
So, basically, the odds are 66%/34% of losing. The odds get worse if yo don't know when to get in the market. Bad market timing can bring the odds down to 80%/20% against you or worse.
If one keeps betting when the odds are 64% (or worse) against you, one will definitely go broke- it's just a question of time!
The trick to trading is to trade as small as possible until you fndsomething that works.
Then, and only then, you can increase your size.
Also, I am new to this site, can you tell me how to post and start a thread?
Good Luck
Originally posted in Traderpedia: http://www.trade2win.com/boards/traderpedia/54928-position-trading.html
After searching for "Position Trading" I came across the post by thetopbloke, and didn't realise I was in the incorrect section to be posting a method of trading.
However ...
This is one of my fav subjects ... position trading. In fact I am completely baffled as to why traders spend so much time trying to make money scalping.
But that's understandable - I suck at scalping!
On the other hand, it could be because of my belief that no trader should attempt to trade FX unless they have managed to master at least 4H charts. I would recommend Daily charts for beginners - but that's me. Obviously people are doing very well through scalping techniques, going by the proliferation of threads covering that method of trading.
I hope one day to graduate to scalping, but it is a deadly environment for slow-wits like me.
Meanwhile - position trading!
I have a method I like to use that involves lagging indicators, though why we have to call them "lagging indicators" is beyond me - they ALL lag!
Set up MT4 chart as follows:
1) Price bars preferred to candles - own choice
2) 4-Period EMA
3) 10-Period SMA
4) RSI 14-Period
5) Stochastic 14,3,3
6) 2-line MACD (with or without histogram) 8,12,9
That is the basic template. I prefer no histogram on MACD as I am simply looking for the lines to cross. Remember too that MACD and Stochastic show different things, and for position traders these are helpful to our decision making.
a) MACD warns us that a trend is beginning to gain momentum, or slowing.
b) Stochastic warns us that a trend is beginning or ending.
The other thing I use Stochastic for, is to tell me the STRENGTH of a trend. You may not agree with me, but for as long as the Stochastic remains above 80 in the "over-bought" zone, the rally will continue hard, and vice versa for under 20 in "over-sold zone." It's just one of the indicators that allows me at a glance to tell if my trade needs maintenance or not.
If Stochastic is above 80, and I am "long" then I don't need to be concerned for the health of my trade.
RSI is an "optional extra" - it's a personal choice, and to be candid, I rarely consciously use it. It can be used to generate confidence depending on whether RSI is already above its 50 line, or turning up from underneath its 50 line. Both of those conditions will mean different things to different traders. Some will wait until RSI DOES cross its 50 line before going "long." I don't - if it is turning up, and agrees with Stochastic, then I become seriously interested in a trade.
The attached chart is the current action in the NZDUSD.
This is a take-your-time trade - no rush, no errors.
But to trade this way you are far better to use LOWER leverage - less than 50:1 and to use stops based on 1.5 x ATR.
Have a play with the concept - I love it.
Other options are to have an additional 2 templates set up identically except for the MA's.
1) 2-Period EMA with 5-Period SMA
2) 6-Period EMA with 15-Period SMA
The fine tuning advantage these additional templates give, is a faster and slower cross respectively of the MA's, or a view of the relative positions of the two MA's. This is the same as looking at different time frames when trading with other styles.
Last comments:
Yes - the relationships hold true for other TF - eg 4Hour and 1Hour.
And no - I don't have the perfect exit for you. These are discretionary according to risk profile. If you are cautionary, you will exit on loss of momentum as shown by MACD, or on potential reversal as shown by Stochastic. My personal choice is to exit when the two MA's cross again, but not always ... sorry I couldn't be clearer about exit.
As I mentioned - I suck at scalping, so can not confirm their usefulness in that genre.
Good luck with it - shouldn't be need for too much comment, unless you wish to post your own nice trades.
Kind Regards
Ingot
Trading is extremely difficult. 1% of the traders make 99% of the money. The reason trading is so difficult is because there are 2 ways to lose and only one way to win.
You lose if the trade is a bust from the get go and you lose when a trade comes back and takes your profit away. The only way to win is to be right out of the box.
So, basically, the odds are 66%/34% of losing. The odds get worse if yo don't know when to get in the market. Bad market timing can bring the odds down to 80%/20% against you or worse.
If one keeps betting when the odds are 64% (or worse) against you, one will definitely go broke- it's just a question of time!
The trick to trading is to trade as small as possible until you fndsomething that works.
Then, and only then, you can increase your size.
Also, I am new to this site, can you tell me how to post and start a thread?
Good Luck
Ingot54
Well-known member
- Messages
- 403
- Likes
- 62
How to start a thread
Thank you for sharing that MrSoul, and welcome to T2W.
You can begin a thread by:
* Clicking on the category or topic where you wish your thread to appear
* Scroll to bottom and find the "New Thread" icon at the bottom-left corner of the "Thread/Thread Starter" window
* Click there and after giving your thread a title, commence your thread/post
I look forward to your thoughts
Kind regards
Ivan
Trading is extremely difficult. 1% of the traders make 99% of the money. The reason trading is so difficult is because there are 2 ways to lose and only one way to win.
You lose if the trade is a bust from the get go and you lose when a trade comes back and takes your profit away. The only way to win is to be right out of the box.
So, basically, the odds are 66%/34% of losing. The odds get worse if yo don't know when to get in the market. Bad market timing can bring the odds down to 80%/20% against you or worse.
If one keeps betting when the odds are 64% (or worse) against you, one will definitely go broke- it's just a question of time!
The trick to trading is to trade as small as possible until you fndsomething that works.
Then, and only then, you can increase your size.
Also, I am new to this site, can you tell me how to post and start a thread?
Good Luck
Thank you for sharing that MrSoul, and welcome to T2W.
You can begin a thread by:
* Clicking on the category or topic where you wish your thread to appear
* Scroll to bottom and find the "New Thread" icon at the bottom-left corner of the "Thread/Thread Starter" window
* Click there and after giving your thread a title, commence your thread/post
I look forward to your thoughts
Kind regards
Ivan
wackypete2
Legendary member
- Messages
- 10,211
- Likes
- 2,058
Ingot54,
I'm generally a scalper, give or take some, I guess. I can use a break after taxes this week though, so I will try your system Monday. Maybe it's just what the Dr. ordered!
Peter
I'm generally a scalper, give or take some, I guess. I can use a break after taxes this week though, so I will try your system Monday. Maybe it's just what the Dr. ordered!
Peter
Ingot54
Well-known member
- Messages
- 403
- Likes
- 62
Position Trading Details
Thank you for your participation.
There are many things to be aware of when trading DAILY charts - not the least of which is the larger drawdown required in order to retain your position.
You are probably well aware of ATR - Average True Range (some people say "Average TRADING Range") and the implications for the time frame (TF) used.
At the risk of being boring, I submit a couple of figures as food for thought. At the time of writing, the ATR for the EURUSD was displaying the following for respective TF:
5 min: 11 pips
15 min: 19 pips
30 min: 21 pips
60 min: 32 pips
4Hr: 68 pips
Daily: 169 pips
Weekly: 510 pips
It might seem very daunting to think you need to be able to withstand all those pips in order to secure a trade, and it may seem worse after I tell you your STOPS should probably be set at 1.5 times ATR (discretionary for each trader of course). But the reality is easier to bear, after you have paper traded this TF a little bit.
For starters, there is NO RUSH to secure your entry or indeed your exit with this method. people moving from Scalping to Position Trading will naturally feel some trepidation as they see the pips slipping away at times, or moving in their direction, and at those times NOT being in position yet.
But "being in position" is the least of your problems if you want to make Position Trading work for you. Being in the "right" position is what this is about.
Slow down - be a hunter - have fun!
If you use any of the templates I have mentioned in the first couple of posts of this thread, you will be waiting for the MA's to cross over to give you your signal. That is the right thing to do, but this is where the skill comes in - and relax mate - a lot of skill is NOT needed - if I can trade this stuff, anyone can. And if you can scalp, Position Trading should be a cinch for you.
I will point out a couple of things that MAY seem obvious to you, but I have to keep in mind I am writing for the newbies in the membership too, so explanations might become tedious if you are already in front of me.
On one of the attached charts I have shown when to enter a trade - and that is AFTER the candle that caused the MA Cross has closed, and the NEW candle has commenced.
But stop right there - there is NO compulsion to ENTER right at that moment, UNLESS you are already aware of the ATR reading, and are thoroughly prepared to accept the drawdown that is inevitable.
On another attached chart I explain WHY the drawdown is inevitable - but in a nutshell, it is because in order for a candle to move, it has to "breathe" - it will move against you for a short time, before beginning its stronger move in the direction of the MA crossover. That is a generalisation - we have all seen Marubuzo Candles - candles where the open is at the LOW of the session and the close is at the HIGH of the session and vice versa. Marubuzo candles have NO upper or lower shadows/tails. They just power away once they start, and push strongly on, concluding at the extreme of their range.
It is for this reason that I recommend looking at the LOWER TF if you want to fine tune your entry. If you can see that the 4H candles are accelerating into the direction of the MA cross, then yes - by all means open your position at the open of the new candle. Under these circumstances, your chances of requiring the drawdown buffer afforded by 1.5 times the ATR of the TF are greatly reduced, but you should be aware that what goes up will also retrace ... and our friends in the Fibonacci threads tell us that this retracement can be 61.8%, 50% or 38.2% ... or in the ball-park of those numbers. Just be apprised of the possibility ... that's all.
Once your position gets into profit, you manage as per your own strategy - the best of which imho is to move your stops to 1.5 times the ATR each new candle. If the move seems to be running out of steam, and you wish to lock in profits - tighten to 1 times ATR or even 0.75 times. And again - consult the 4H TF to get a picture, as well as the next higher TF: the WEEKLY.
NOTE: When looking at other TF be certain to zoom OUT a click or two if using MT4 platforms, or for that matter any other. The reason is that you are actually wanting to get into a longer term trend, and if you can see on the WEEKLY chart that the uptrend is very powerful, you might like to rethink your stop strategy to allow for the pull-back that is occurring. Zooming out gives you that perspective. I'm sure you have experienced taking an exit early because of a pull-back, only to find later that your trade was initially correctly placed in line with the trend, which then resumed without you.
Perspective is a very important ally when considering entry and exit, but I suspect few traders bother to consult the TF on either side of their trades, and miss out on better managing their activities because of it.
While you may not know for sure if the pull-back is the beginning of a reversal, at least being aware of it can vastly improve the decisions you make in managing the trade. One of the things that are inherent in Position Trading methods, is that you will always be leaving quite a lot of pips on the table at your exit. Your attitude to this should be positive. At exit, you will KNOW that you have given the trade EVERY opportunity to "breathe" and to move in your direction.
Inevitably the trade WILL end its trend and you will either close out or be closed out. The upside is that overall, trading this way, you will be in MANY MORE trades that capture HUGE rallies when they happen. Instead of managing 7 or 10 trades where you are in and out of the market in a day, or several times in a day with this method you will be in and out of a trade in a few days to a few weeks. And I can assure you, on average, your pip count will far exceed your scalping efforts.
Now in order to achieve this with small accounts, you would need to be trading either minis or micros, so that you can have those 1.5 ATR stops in place.
One of my secret weapons if I can put it that way, is to look at Stochastic (14 period will do). If your trade is in a strong uptrend, try to time entry for when it is in a pull-back from that state. When this occurs, you will see Stochastic drop to an OVERSOLD condition. However, because the Uptrend is the dominant feature of the trend, the trend WILL resume - evidenced by the MA Cross - and it is when Stochastic is emerging from Oversold that the best entries are made. This is one of the best uses for Stochastic. Be aware though, you will NOT see this phenomenon on the HIGHER TF when looking for entry - this will only show up on the VERY small TF like 30min when being really pedantic about entry.
In closing this post, I want to add that I have read on some forums that traders dismiss MA Crossover-type trading as being somehow inferior to more sophisticated methods. Thsi might be correct ... or not. Over the next week or two, I hope to place some trades as they happen, to illustrate how this method can work. You and the reader can then be in the box seat to judge if Position Trading a MA Cross is too simple to work.
Be aware of the DOMINANT trend as evidenced by HIGHER TF, and only consider trades in conformity with this trend. Further probability of success can be found by entering on pull-back as shown by Stochastic activity as I mentioned.
Keep in mind that I have given you three templates in the first post or two in this thread - all of which can be clicked through on the DAILY chart to get an even broader perspective:
Short Term: 2-period EMA with 5-period SMA
Medium Term: 4-period EMA with 10-period SMA
Long term: 6-period EMA with 15-period SMA
Peter - as you know - trading is simple but not easy. If it can be shown that a method works, and that traders can use their own strategy to manage their method into profit, then that's all that is required. If you do have a crack at this longer term stuff, I promise you this: If you are patient, and if you are prepared to use sound money management techniques, then you will not fail.
It does require patience and discipline - but I hope to show that the rewards are there, and for far less effort than you may have been using in your scalping methods.
With best wishes
Ivan
Hi PeterIngot54,
I'm generally a scalper, give or take some, I guess. I can use a break after taxes this week though, so I will try your system Monday. Maybe it's just what the Dr. ordered!
Peter
Thank you for your participation.
There are many things to be aware of when trading DAILY charts - not the least of which is the larger drawdown required in order to retain your position.
You are probably well aware of ATR - Average True Range (some people say "Average TRADING Range") and the implications for the time frame (TF) used.
At the risk of being boring, I submit a couple of figures as food for thought. At the time of writing, the ATR for the EURUSD was displaying the following for respective TF:
5 min: 11 pips
15 min: 19 pips
30 min: 21 pips
60 min: 32 pips
4Hr: 68 pips
Daily: 169 pips
Weekly: 510 pips
It might seem very daunting to think you need to be able to withstand all those pips in order to secure a trade, and it may seem worse after I tell you your STOPS should probably be set at 1.5 times ATR (discretionary for each trader of course). But the reality is easier to bear, after you have paper traded this TF a little bit.
For starters, there is NO RUSH to secure your entry or indeed your exit with this method. people moving from Scalping to Position Trading will naturally feel some trepidation as they see the pips slipping away at times, or moving in their direction, and at those times NOT being in position yet.
But "being in position" is the least of your problems if you want to make Position Trading work for you. Being in the "right" position is what this is about.
Slow down - be a hunter - have fun!
If you use any of the templates I have mentioned in the first couple of posts of this thread, you will be waiting for the MA's to cross over to give you your signal. That is the right thing to do, but this is where the skill comes in - and relax mate - a lot of skill is NOT needed - if I can trade this stuff, anyone can. And if you can scalp, Position Trading should be a cinch for you.
I will point out a couple of things that MAY seem obvious to you, but I have to keep in mind I am writing for the newbies in the membership too, so explanations might become tedious if you are already in front of me.
On one of the attached charts I have shown when to enter a trade - and that is AFTER the candle that caused the MA Cross has closed, and the NEW candle has commenced.
But stop right there - there is NO compulsion to ENTER right at that moment, UNLESS you are already aware of the ATR reading, and are thoroughly prepared to accept the drawdown that is inevitable.
On another attached chart I explain WHY the drawdown is inevitable - but in a nutshell, it is because in order for a candle to move, it has to "breathe" - it will move against you for a short time, before beginning its stronger move in the direction of the MA crossover. That is a generalisation - we have all seen Marubuzo Candles - candles where the open is at the LOW of the session and the close is at the HIGH of the session and vice versa. Marubuzo candles have NO upper or lower shadows/tails. They just power away once they start, and push strongly on, concluding at the extreme of their range.
It is for this reason that I recommend looking at the LOWER TF if you want to fine tune your entry. If you can see that the 4H candles are accelerating into the direction of the MA cross, then yes - by all means open your position at the open of the new candle. Under these circumstances, your chances of requiring the drawdown buffer afforded by 1.5 times the ATR of the TF are greatly reduced, but you should be aware that what goes up will also retrace ... and our friends in the Fibonacci threads tell us that this retracement can be 61.8%, 50% or 38.2% ... or in the ball-park of those numbers. Just be apprised of the possibility ... that's all.
Once your position gets into profit, you manage as per your own strategy - the best of which imho is to move your stops to 1.5 times the ATR each new candle. If the move seems to be running out of steam, and you wish to lock in profits - tighten to 1 times ATR or even 0.75 times. And again - consult the 4H TF to get a picture, as well as the next higher TF: the WEEKLY.
NOTE: When looking at other TF be certain to zoom OUT a click or two if using MT4 platforms, or for that matter any other. The reason is that you are actually wanting to get into a longer term trend, and if you can see on the WEEKLY chart that the uptrend is very powerful, you might like to rethink your stop strategy to allow for the pull-back that is occurring. Zooming out gives you that perspective. I'm sure you have experienced taking an exit early because of a pull-back, only to find later that your trade was initially correctly placed in line with the trend, which then resumed without you.
Perspective is a very important ally when considering entry and exit, but I suspect few traders bother to consult the TF on either side of their trades, and miss out on better managing their activities because of it.
While you may not know for sure if the pull-back is the beginning of a reversal, at least being aware of it can vastly improve the decisions you make in managing the trade. One of the things that are inherent in Position Trading methods, is that you will always be leaving quite a lot of pips on the table at your exit. Your attitude to this should be positive. At exit, you will KNOW that you have given the trade EVERY opportunity to "breathe" and to move in your direction.
Inevitably the trade WILL end its trend and you will either close out or be closed out. The upside is that overall, trading this way, you will be in MANY MORE trades that capture HUGE rallies when they happen. Instead of managing 7 or 10 trades where you are in and out of the market in a day, or several times in a day with this method you will be in and out of a trade in a few days to a few weeks. And I can assure you, on average, your pip count will far exceed your scalping efforts.
Now in order to achieve this with small accounts, you would need to be trading either minis or micros, so that you can have those 1.5 ATR stops in place.
One of my secret weapons if I can put it that way, is to look at Stochastic (14 period will do). If your trade is in a strong uptrend, try to time entry for when it is in a pull-back from that state. When this occurs, you will see Stochastic drop to an OVERSOLD condition. However, because the Uptrend is the dominant feature of the trend, the trend WILL resume - evidenced by the MA Cross - and it is when Stochastic is emerging from Oversold that the best entries are made. This is one of the best uses for Stochastic. Be aware though, you will NOT see this phenomenon on the HIGHER TF when looking for entry - this will only show up on the VERY small TF like 30min when being really pedantic about entry.
In closing this post, I want to add that I have read on some forums that traders dismiss MA Crossover-type trading as being somehow inferior to more sophisticated methods. Thsi might be correct ... or not. Over the next week or two, I hope to place some trades as they happen, to illustrate how this method can work. You and the reader can then be in the box seat to judge if Position Trading a MA Cross is too simple to work.
Be aware of the DOMINANT trend as evidenced by HIGHER TF, and only consider trades in conformity with this trend. Further probability of success can be found by entering on pull-back as shown by Stochastic activity as I mentioned.
Keep in mind that I have given you three templates in the first post or two in this thread - all of which can be clicked through on the DAILY chart to get an even broader perspective:
Short Term: 2-period EMA with 5-period SMA
Medium Term: 4-period EMA with 10-period SMA
Long term: 6-period EMA with 15-period SMA
Peter - as you know - trading is simple but not easy. If it can be shown that a method works, and that traders can use their own strategy to manage their method into profit, then that's all that is required. If you do have a crack at this longer term stuff, I promise you this: If you are patient, and if you are prepared to use sound money management techniques, then you will not fail.
It does require patience and discipline - but I hope to show that the rewards are there, and for far less effort than you may have been using in your scalping methods.
With best wishes
Ivan
Attachments
Last edited:
spreader_legger
Well-known member
- Messages
- 447
- Likes
- 38
Hi there
Very interested to get into position trading alonside my short-term scalping efforts
I am, however, still grappling with MT4 (used to use esignal). How do you get the 4 period EMA & the 10 period SMA onto the same chart?
I have also noticed from one of your posts, that you have quite a few trades open at any one time. What money management techniques do you use? Do you take correlations between the products into account?
Quite impressed by your 2000000 + account ..... If only that were real money? Do you trade for real yet?
Many thanks,
Stefan
Originally posted in Traderpedia: http://www.trade2win.com/boards/traderpedia/54928-position-trading.html
After searching for "Position Trading" I came across the post by thetopbloke, and didn't realise I was in the incorrect section to be posting a method of trading.
However ...
This is one of my fav subjects ... position trading. In fact I am completely baffled as to why traders spend so much time trying to make money scalping.
But that's understandable - I suck at scalping!
On the other hand, it could be because of my belief that no trader should attempt to trade FX unless they have managed to master at least 4H charts. I would recommend Daily charts for beginners - but that's me. Obviously people are doing very well through scalping techniques, going by the proliferation of threads covering that method of trading.
I hope one day to graduate to scalping, but it is a deadly environment for slow-wits like me.
Meanwhile - position trading!
I have a method I like to use that involves lagging indicators, though why we have to call them "lagging indicators" is beyond me - they ALL lag!
Set up MT4 chart as follows:
1) Price bars preferred to candles - own choice
2) 4-Period EMA
3) 10-Period SMA
4) RSI 14-Period
5) Stochastic 14,3,3
6) 2-line MACD (with or without histogram) 8,12,9
That is the basic template. I prefer no histogram on MACD as I am simply looking for the lines to cross. Remember too that MACD and Stochastic show different things, and for position traders these are helpful to our decision making.
a) MACD warns us that a trend is beginning to gain momentum, or slowing.
b) Stochastic warns us that a trend is beginning or ending.
The other thing I use Stochastic for, is to tell me the STRENGTH of a trend. You may not agree with me, but for as long as the Stochastic remains above 80 in the "over-bought" zone, the rally will continue hard, and vice versa for under 20 in "over-sold zone." It's just one of the indicators that allows me at a glance to tell if my trade needs maintenance or not.
If Stochastic is above 80, and I am "long" then I don't need to be concerned for the health of my trade.
RSI is an "optional extra" - it's a personal choice, and to be candid, I rarely consciously use it. It can be used to generate confidence depending on whether RSI is already above its 50 line, or turning up from underneath its 50 line. Both of those conditions will mean different things to different traders. Some will wait until RSI DOES cross its 50 line before going "long." I don't - if it is turning up, and agrees with Stochastic, then I become seriously interested in a trade.
The attached chart is the current action in the NZDUSD.
This is a take-your-time trade - no rush, no errors.
But to trade this way you are far better to use LOWER leverage - less than 50:1 and to use stops based on 1.5 x ATR.
Have a play with the concept - I love it.
Other options are to have an additional 2 templates set up identically except for the MA's.
1) 2-Period EMA with 5-Period SMA
2) 6-Period EMA with 15-Period SMA
The fine tuning advantage these additional templates give, is a faster and slower cross respectively of the MA's, or a view of the relative positions of the two MA's. This is the same as looking at different time frames when trading with other styles.
Last comments:
Yes - the relationships hold true for other TF - eg 4Hour and 1Hour.
And no - I don't have the perfect exit for you. These are discretionary according to risk profile. If you are cautionary, you will exit on loss of momentum as shown by MACD, or on potential reversal as shown by Stochastic. My personal choice is to exit when the two MA's cross again, but not always ... sorry I couldn't be clearer about exit.
As I mentioned - I suck at scalping, so can not confirm their usefulness in that genre.
Good luck with it - shouldn't be need for too much comment, unless you wish to post your own nice trades.
Kind Regards
Ingot
Ingot54
Well-known member
- Messages
- 403
- Likes
- 62
MT4 issues
Hi Stefan
You might get more help from the people contributing to the MT4 threads, but to answer your question:
How do you get the 4 period EMA & the 10 period SMA onto the same chart?
do the following:
Go to the top left of your MT4 tool bar
Click "Insert"
Click "Indicators"
Click "Trend"
Click "Moving Average"
In the utility box that opens, you can set any MA parameters you wish, including Simple, Smoothed, Linear Weighted, or Exponential. You should research for yourself what advantage each of these offers, but if you play around by adding a Simple MA alongside an Exponential MA you will come to realise they are vastly different in where they sit on the chart.
Consequently, my choice of a combination of Simple MA and Exponential MA in different periods, gives me a predictive edge. I can not disclose here why I use this combination - just accept it.
Similarly you can apply the MA to the open/close or other choices offered, plus you can change the thickness of the lines and their colours.
I suggest you go here:
On the open MT4 platform, go to the top toolbar.
Click "Help" and then click "Help Topics" I suggest you spend a few minutes here fequently - it is a great platform and worthy of your using it correctly. You will be highly rewared for your time spent.
Click "User Interface" and select "Toolbars" then "Line Studies"
You will find all the icons there and what they do, how to use them and so on.
I suggest you find out how to add "Indicators" and also "Custom Indicators" from your "Navigator" menu which opens when you click the yellow "Star" icon on the tool bar.
Dragging and dropping any of the "Function" icons attached to the indicator you want (the "f" symbol attached to each indicator) will give you other options to customise your MT4 platform. Before you click "OK" to accept the indicator on to your platform, you can change colours, periodicity, levels and display preferences (thick or thin or dotted lines).
I can't give you more than that in a thread like this - you will have to spend some time on the platform your self, and perhaps get involved in any of the MT4 dedicated forums. One thing that is indispensible in today's TA world, is the ability to create and customise charting.
MT4 offers this to the nth degree.
You may already know how to right-click on your MT4 screen and select "Properties" in order to change "Background" and the colours of your up and down bars, as well as the colours of the body of the candles and so on. You can even toggle the "Grid" on and off (I never use it) on the right-click function, or you can use the "Properties" function to change the colour of the grid so that it appears much fainter on the particular background you choose.
Also if you want to understand trend, get used to the Zoom function on the top tool bar. Use it in any and all TF - 1H and 4H and Daily and Weekly. This will give you an "aha" moment in uncovering trend. Once you do this the trend-within-trend-within-trend will pop out at you with such clarity, that you may never want to go back to scalping again. Or if you do, you will understand the volatility and the actions of your data feed supplier so much better.
Hope that helps
Kind regards
Ivan
PS: If you look closely at the 2 charts attached, you will easily spot that while each chart represents a 4-period and 10-period MA respectively, within each chart the difference is that one coloured line is a LINEAR WEIGHTED MA and the other coloured line is a SMOOTHED MA. I didn't add the EMA or SMA's because although the difference are just a clear, the chart would have lost its message through clutter.
I don't know all that much about the MT4 platform - just what I found for myself in what I wanted to do with my charts.
Hope that helps.
Hi there
Very interested to get into position trading alonside my short-term scalping efforts
I am, however, still grappling with MT4 (used to use esignal). How do you get the 4 period EMA & the 10 period SMA onto the same chart?
......
Many thanks,
Stefan
Hi Stefan
You might get more help from the people contributing to the MT4 threads, but to answer your question:
How do you get the 4 period EMA & the 10 period SMA onto the same chart?
do the following:
Go to the top left of your MT4 tool bar
Click "Insert"
Click "Indicators"
Click "Trend"
Click "Moving Average"
In the utility box that opens, you can set any MA parameters you wish, including Simple, Smoothed, Linear Weighted, or Exponential. You should research for yourself what advantage each of these offers, but if you play around by adding a Simple MA alongside an Exponential MA you will come to realise they are vastly different in where they sit on the chart.
Consequently, my choice of a combination of Simple MA and Exponential MA in different periods, gives me a predictive edge. I can not disclose here why I use this combination - just accept it.
Similarly you can apply the MA to the open/close or other choices offered, plus you can change the thickness of the lines and their colours.
I suggest you go here:
On the open MT4 platform, go to the top toolbar.
Click "Help" and then click "Help Topics" I suggest you spend a few minutes here fequently - it is a great platform and worthy of your using it correctly. You will be highly rewared for your time spent.
Click "User Interface" and select "Toolbars" then "Line Studies"
You will find all the icons there and what they do, how to use them and so on.
I suggest you find out how to add "Indicators" and also "Custom Indicators" from your "Navigator" menu which opens when you click the yellow "Star" icon on the tool bar.
Dragging and dropping any of the "Function" icons attached to the indicator you want (the "f" symbol attached to each indicator) will give you other options to customise your MT4 platform. Before you click "OK" to accept the indicator on to your platform, you can change colours, periodicity, levels and display preferences (thick or thin or dotted lines).
I can't give you more than that in a thread like this - you will have to spend some time on the platform your self, and perhaps get involved in any of the MT4 dedicated forums. One thing that is indispensible in today's TA world, is the ability to create and customise charting.
MT4 offers this to the nth degree.
You may already know how to right-click on your MT4 screen and select "Properties" in order to change "Background" and the colours of your up and down bars, as well as the colours of the body of the candles and so on. You can even toggle the "Grid" on and off (I never use it) on the right-click function, or you can use the "Properties" function to change the colour of the grid so that it appears much fainter on the particular background you choose.
Also if you want to understand trend, get used to the Zoom function on the top tool bar. Use it in any and all TF - 1H and 4H and Daily and Weekly. This will give you an "aha" moment in uncovering trend. Once you do this the trend-within-trend-within-trend will pop out at you with such clarity, that you may never want to go back to scalping again. Or if you do, you will understand the volatility and the actions of your data feed supplier so much better.
Hope that helps
Kind regards
Ivan
PS: If you look closely at the 2 charts attached, you will easily spot that while each chart represents a 4-period and 10-period MA respectively, within each chart the difference is that one coloured line is a LINEAR WEIGHTED MA and the other coloured line is a SMOOTHED MA. I didn't add the EMA or SMA's because although the difference are just a clear, the chart would have lost its message through clutter.
I don't know all that much about the MT4 platform - just what I found for myself in what I wanted to do with my charts.
Hope that helps.
Attachments
Ingot54
Well-known member
- Messages
- 403
- Likes
- 62
Getting a LIFE
I want to address your question about number of trades open, and trade management and so on. And I want you to know that my comments are not directed personally at you - I write for all readers.
Firstly you should notice that when I posted the screen shot of the open trades, those 9 trades were all opened within a ten minute period on 2nd April 2009. I opened these as I was about to walk out the door to work - a testimony to luck!
And a testimony to the method!
How easy was it to eyeball each chart to find ones that had crossed and were probably past initial setup stage. However from experience I knew that once set up, many of these have heaps of time left to run, and so I entered - straight up out of the blue!
I didn't post this bit: although these trades ran to $227k+ ... they also ran right back down to MINUS $5k at one point. Now you might think I am crazy for not taking the profits. Well in real life I would have, of course, but in demo ...!
One of the very best things that you can use demo for, is to allow trades to do what they want WHILE YOU WATCH. There is NO compulsion to take profits off the table if you can get into learning mode, and just observe. If you can do that you will see the cyclical nature of the markets, and you will gain insights you would never have otherwise.
And you will notice that even if you make a poor entry, as long as you have traded in the direction of the DOMINANT trend, you will eventually get out of trouble, and perhaps make a profit.
The dominant trend is a rescuer of the poor entry.
In real life I would never have more than 2 trades open at any time. One reason is that traders need to give all their attention to one trade ... maximum two. Further, if your method is robust, there is nothing wrong with loading up your position size according to your 2% rule (or whatever your risk strategy calls for) and maxing out your profits this way. No need to have multiple trades going simultaneously - you run the risk of spreading your focus too thinly and missing key reversal points when they occur.
I plan to focus on about a half dozen currency pairs, with special attention to ensure I do NOT trade pairs with positive or negative correlation.
You are aware of the positive correlation between the EURUSD and the GBP USD - that is - when the EURUSD is rallying, so too is the GBPUSD. What is the point in having one two trades open simultaneously, which always mimic each other's direction? (with occasional divergences)
Similarly, the AUDUSD and the USDCAD will run counter to each other as a general rule. Both are commodity-based economies, and will run opposite each other according to strength and /or weakness in the USD. Generally, of course.
It would be foolish to trade "long" on both the USDCAD and the AUDUSD - counter productive, yet many traders (including myself) have done this.
One of the reasons I decided to focus on Position Trading ie trading over several days ... even weeks ... was to escape the daily screen gazing sessions that have isolated me from my family for several years, while living under the same roof!
I found that trading DAILY charts have not only delivered MORE pips, they deliver them MORE reliably, and MANY more of them. And the management of the trade is so different and easier. The risks and stress are so much lower.
Over the next week or two I am planning, as time allows, to post a real-time trade, that unfolds from signal, trigger, entry, management and finally exit. I will give my rules and reasons, as well as any reasons for discretionary actions. Nothing could be clearer than that, nor easier to follow ... I expect!
I will probably open a new thread for the exercise, so keep an eye out for it ... I will post the section link here when it happens.
On a more philosophical note - consider this:
"Scared Money" doesn't win - the key element of success ... confidence!
"Angry Money" doesn't win - revenge trading leaves the trader with ashes in his mouth.
"Tired Money" doesn't win - the fatigued trader can not bring clarity and focus to his trades.
"Confused Money" doesn't win - traders need to be crystal clear about their actions
"Desperate Money" doesn't win - traders desperate to win will gamble.
"Hasty Money" doesn't win - needing to "quickly pull the trigger" leads to trader error.
"Borrowed Money" doesn't win - the pressure to repay leads to some of the previous listed errors.
"Deceitful Money" doesn't win - stolen fruit is sweet - but has to be concealed. Losing conceals permanently!
"Addicted Money" doesn't win - the trader is in for the hunt, not the kill.
Trading is not something that can be done (in general) in haste - thus the reason many scalpers come to grief. If you are able to take your time to reflect on what the market is telling you, and to carefully check price action, indicators, or the entrails - whatever your method calls for - then you are at the right place.
My position trading method offers this.
Hopefully this approach will enable traders to get off the treadmill and get their lives back. For many this will come too late - they will have lost their families through separation or emotional estrangement, while they pursue their addiction to trading.
Ostensibly the addicted trader will say that they are trading to give their families a better lifestyle. Yet they do not stop trading long enough to either anaylse what they are doing right/wrong, and they do not stop long enough to consider that there are other methods to trade that yield infinitely more pleasure, without the stress.
Meanwhile, in excess of 80% are said to be losing, or making nothing.
Crazy! Why is it that they keep on going?
The truth is the reality.
If you are getting negative vibes from your loved ones, perhaps it is time to pull up from what you are doing, and take a bit of time out to reflect.
I am speaking from experience. I am just a cyber persona, and as such I have nothing to gain through being honest about my own situation.
If you want your trading to make money for you, learn to do the things that make money.
Repeating the same trading activities week after week, expecting somehow to discover a great indicator, or a great method, and that somehow you will suddenly begin to be profitable ... no - sorry - for THINGS to change, YOU have to CHANGE.
I can only say that I am NOT wasting my time in this thread. I know what I am doing, and I know what I am talking about. And I know there are people out there who are desperate to improve their record. I have no web page, and no Blog. I have never sold any method, not do I intend to sell any in the future. And I am not affiliated with anyone who is selling anything.
I have always just wanted to share what is good for traders in my own view.
My own failures have been a direct result of my own greed - particularly though straying down towards the shorter TF in trading!!
Google these:
Ingot 54
Ingots Rainbow - a position Trading Strategy
Ingots Rainbow 3-D MA Charts (note the date I "invented" these)
Ingot's Rainbow Forex Method
Forex Made Easy - Ingots Rainbow Strategy
Rainbow 3D Moving Averages
Most of the above centres on the Rainbow Method - remember that it is just one more way of looking at LONG TERM chart trends. Some of us are VISUALLY inclined and as such the 3-D effect of the Rainbow charts helps to quickly work out where trend is going. Others are strictly technically minded, and need to see scientific proof via their indicators, that trend is indeed moving in a specific direction.
These are all just tools of our trade.
The real method is inside your head, in the form of a commitment to a belief.
If I have not been able to convince you to get out of the muddy shallow waters of trading turbulence and noise, where news can wipe you out in a heart-beat, and out into the deeper, clearer flowing streams of dominant trends, then there is litle more to say about it.
I have utmost respect for scalpers - they are doing a job that is impossible for me. I simply can not get my head around the requirements for scalping. I have had a measure of success on 1H charts, but shorter than that is crazy for me.
And I have utmost respect for YOU, the reader - a trader just like me, with hopes and dreams to gain success from this challenging pursuit. I remember that behind the username there is a living person who is frequently hurting - my posts are an effort to make a difference.
With best Wishes
Ivan
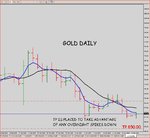
PS - In the attached chart, I show a very strong SHORT setup for Gold. When Gold opens after this weekend, consider going short. be prepared for drawdown as it feints "long" for awhile, but the DOMINANT trend is DOWN, and because we are trading in line with the Dominant trend, we have an edge - a higher probability of success. You can set target profits or whatever you wish. And you can fine tune the entry through dropping down to the 4H chart. Keep an eye on Stochastics on the 1H and/or 30/min charts if you really wish to split hairs and limit drawdown.
Ask yourself these questions:
Where would Gold have to be on Monday for me to consider entering the trade?
Where would Gold then have to go to for me to consider remaining in the trade?
Where would Gold have to be for me to consider taking profits from this trade?
Where would Gold have to go for me to consider remaining in the trade for longer?
Hi again StefanHi there
Very interested to get into position trading alonside my short-term scalping efforts
I have also noticed from one of your posts, that you have quite a few trades open at any one time. What money management techniques do you use? Do you take correlations between the products into account?
Quite impressed by your 2000000 + account ..... If only that were real money? Do you trade for real yet?
Many thanks,
Stefan
I want to address your question about number of trades open, and trade management and so on. And I want you to know that my comments are not directed personally at you - I write for all readers.
Firstly you should notice that when I posted the screen shot of the open trades, those 9 trades were all opened within a ten minute period on 2nd April 2009. I opened these as I was about to walk out the door to work - a testimony to luck!
And a testimony to the method!
How easy was it to eyeball each chart to find ones that had crossed and were probably past initial setup stage. However from experience I knew that once set up, many of these have heaps of time left to run, and so I entered - straight up out of the blue!
I didn't post this bit: although these trades ran to $227k+ ... they also ran right back down to MINUS $5k at one point. Now you might think I am crazy for not taking the profits. Well in real life I would have, of course, but in demo ...!
One of the very best things that you can use demo for, is to allow trades to do what they want WHILE YOU WATCH. There is NO compulsion to take profits off the table if you can get into learning mode, and just observe. If you can do that you will see the cyclical nature of the markets, and you will gain insights you would never have otherwise.
And you will notice that even if you make a poor entry, as long as you have traded in the direction of the DOMINANT trend, you will eventually get out of trouble, and perhaps make a profit.
The dominant trend is a rescuer of the poor entry.
In real life I would never have more than 2 trades open at any time. One reason is that traders need to give all their attention to one trade ... maximum two. Further, if your method is robust, there is nothing wrong with loading up your position size according to your 2% rule (or whatever your risk strategy calls for) and maxing out your profits this way. No need to have multiple trades going simultaneously - you run the risk of spreading your focus too thinly and missing key reversal points when they occur.
I plan to focus on about a half dozen currency pairs, with special attention to ensure I do NOT trade pairs with positive or negative correlation.
You are aware of the positive correlation between the EURUSD and the GBP USD - that is - when the EURUSD is rallying, so too is the GBPUSD. What is the point in having one two trades open simultaneously, which always mimic each other's direction? (with occasional divergences)
Similarly, the AUDUSD and the USDCAD will run counter to each other as a general rule. Both are commodity-based economies, and will run opposite each other according to strength and /or weakness in the USD. Generally, of course.
It would be foolish to trade "long" on both the USDCAD and the AUDUSD - counter productive, yet many traders (including myself) have done this.
One of the reasons I decided to focus on Position Trading ie trading over several days ... even weeks ... was to escape the daily screen gazing sessions that have isolated me from my family for several years, while living under the same roof!
I found that trading DAILY charts have not only delivered MORE pips, they deliver them MORE reliably, and MANY more of them. And the management of the trade is so different and easier. The risks and stress are so much lower.
Over the next week or two I am planning, as time allows, to post a real-time trade, that unfolds from signal, trigger, entry, management and finally exit. I will give my rules and reasons, as well as any reasons for discretionary actions. Nothing could be clearer than that, nor easier to follow ... I expect!
I will probably open a new thread for the exercise, so keep an eye out for it ... I will post the section link here when it happens.
On a more philosophical note - consider this:
"Scared Money" doesn't win - the key element of success ... confidence!
"Angry Money" doesn't win - revenge trading leaves the trader with ashes in his mouth.
"Tired Money" doesn't win - the fatigued trader can not bring clarity and focus to his trades.
"Confused Money" doesn't win - traders need to be crystal clear about their actions
"Desperate Money" doesn't win - traders desperate to win will gamble.
"Hasty Money" doesn't win - needing to "quickly pull the trigger" leads to trader error.
"Borrowed Money" doesn't win - the pressure to repay leads to some of the previous listed errors.
"Deceitful Money" doesn't win - stolen fruit is sweet - but has to be concealed. Losing conceals permanently!
"Addicted Money" doesn't win - the trader is in for the hunt, not the kill.
Trading is not something that can be done (in general) in haste - thus the reason many scalpers come to grief. If you are able to take your time to reflect on what the market is telling you, and to carefully check price action, indicators, or the entrails - whatever your method calls for - then you are at the right place.
My position trading method offers this.
Hopefully this approach will enable traders to get off the treadmill and get their lives back. For many this will come too late - they will have lost their families through separation or emotional estrangement, while they pursue their addiction to trading.
Ostensibly the addicted trader will say that they are trading to give their families a better lifestyle. Yet they do not stop trading long enough to either anaylse what they are doing right/wrong, and they do not stop long enough to consider that there are other methods to trade that yield infinitely more pleasure, without the stress.
Meanwhile, in excess of 80% are said to be losing, or making nothing.
Crazy! Why is it that they keep on going?
The truth is the reality.
If you are getting negative vibes from your loved ones, perhaps it is time to pull up from what you are doing, and take a bit of time out to reflect.
I am speaking from experience. I am just a cyber persona, and as such I have nothing to gain through being honest about my own situation.
If you want your trading to make money for you, learn to do the things that make money.
Repeating the same trading activities week after week, expecting somehow to discover a great indicator, or a great method, and that somehow you will suddenly begin to be profitable ... no - sorry - for THINGS to change, YOU have to CHANGE.
I can only say that I am NOT wasting my time in this thread. I know what I am doing, and I know what I am talking about. And I know there are people out there who are desperate to improve their record. I have no web page, and no Blog. I have never sold any method, not do I intend to sell any in the future. And I am not affiliated with anyone who is selling anything.
I have always just wanted to share what is good for traders in my own view.
My own failures have been a direct result of my own greed - particularly though straying down towards the shorter TF in trading!!
Google these:
Ingot 54
Ingots Rainbow - a position Trading Strategy
Ingots Rainbow 3-D MA Charts (note the date I "invented" these)
Ingot's Rainbow Forex Method
Forex Made Easy - Ingots Rainbow Strategy
Rainbow 3D Moving Averages
Most of the above centres on the Rainbow Method - remember that it is just one more way of looking at LONG TERM chart trends. Some of us are VISUALLY inclined and as such the 3-D effect of the Rainbow charts helps to quickly work out where trend is going. Others are strictly technically minded, and need to see scientific proof via their indicators, that trend is indeed moving in a specific direction.
These are all just tools of our trade.
The real method is inside your head, in the form of a commitment to a belief.
If I have not been able to convince you to get out of the muddy shallow waters of trading turbulence and noise, where news can wipe you out in a heart-beat, and out into the deeper, clearer flowing streams of dominant trends, then there is litle more to say about it.
I have utmost respect for scalpers - they are doing a job that is impossible for me. I simply can not get my head around the requirements for scalping. I have had a measure of success on 1H charts, but shorter than that is crazy for me.
And I have utmost respect for YOU, the reader - a trader just like me, with hopes and dreams to gain success from this challenging pursuit. I remember that behind the username there is a living person who is frequently hurting - my posts are an effort to make a difference.
With best Wishes
Ivan
PS - In the attached chart, I show a very strong SHORT setup for Gold. When Gold opens after this weekend, consider going short. be prepared for drawdown as it feints "long" for awhile, but the DOMINANT trend is DOWN, and because we are trading in line with the Dominant trend, we have an edge - a higher probability of success. You can set target profits or whatever you wish. And you can fine tune the entry through dropping down to the 4H chart. Keep an eye on Stochastics on the 1H and/or 30/min charts if you really wish to split hairs and limit drawdown.
Ask yourself these questions:
Where would Gold have to be on Monday for me to consider entering the trade?
Where would Gold then have to go to for me to consider remaining in the trade?
Where would Gold have to be for me to consider taking profits from this trade?
Where would Gold have to go for me to consider remaining in the trade for longer?
Attachments
Last edited:
Ingot54
Well-known member
- Messages
- 403
- Likes
- 62
gold trade
Gold is subject to not only the supply/demand of hedging but also to emotional supply and demand. Now if these weren't enough to provide a volatile instrument, Gold is also subject to the whims of the Stock markets.
As the DOW rises, GOLD falls. And so if today is a down day on the DOW, we could see Gold shoot up $20 and maybe even stop us out. You need tight management to withstand that volatility, and deep pockets to trade Gold. Some will disagree, but let's just say we'll deal with it here as a peculiarity rather than as a standard trade in a currency trading thread.
I am more interested in going through the method and technical setup than in actually achieving any secondary goal such as a profit. The primary goal is to conserve capital. Sticking to a method is one way of conserving capital in trading.
This morning (Australian time) the Sydney Gold market opened at $868.50 and traded ONE CONTRACT before moving to a NEW candle!!
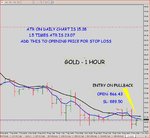
It then traded 5 contracts in the first 5 minutes, and another 1 contract over the next 5 minutes. Clearly this price can not be believed!! Such a LOW VOLUME market is bound to be unreliable and volatile. Consequently, any attempt at a technical entry would be rubbish.
However, the method is screaming for an entry, and I dropped down to the 1H TF to see what's up. I found what I thought was a pull-back, and simply jumped in.
GOLD: Short
Open: $866.43 including spread of $1.00
STOP: $889.50 based on 1.5 times ATR
ATR was $15.38 so SL is (1.5 x 15.38) = $23.07
Stop = Open + (1.5 x ATR) = 866.43 + 23.07 = 889.50
Note that this ATR was calculated from the DAILY bars/candles because this is based on trading the DAILY ranges.
LEVERAGE:
My platform is the FxPro Demo, and I have it set at 100:1 for Mini trading lots.
Consequently, a $1 move in Gold will be worth $100 to my account, gain or loss.
Initially twe can expect the price to breathe a bit - and take notice that in DAILY bars, this can be about one third of the ATR under "non-volatile, trending conditions" which we are hoping for. If we don't get a smooth trend, then we have our Stop in place to protect from catastrophe. Gold can be costly to trade if you mess it up - have the stops there, or pay the price.
As I write, I have already taken the screen shots of the entry. But I have seen Gold rally by $3.67 since entry (on my FxPro data) and so my account was in the red to the tune of $367. Right at this moment, it is improving a touch, and I have negative $322.
I'll post this now, and continue with the plan of management.
Rather than open a new thread for this trade, I decided to keep it here. The reason is that it is not a trade for newbies really, due to the high potential cost of managing drawdown in this metal.PS - In the attached chart, I show a very strong SHORT setup for Gold. When Gold opens after this weekend, consider going short. be prepared for drawdown as it feints "long" for awhile, but the DOMINANT trend is DOWN, and because we are trading in line with the Dominant trend, we have an edge - a higher probability of success. You can set target profits or whatever you wish. And you can fine tune the entry through dropping down to the 4H chart. Keep an eye on Stochastics on the 1H and/or 30/min charts if you really wish to split hairs and limit drawdown.
Gold is subject to not only the supply/demand of hedging but also to emotional supply and demand. Now if these weren't enough to provide a volatile instrument, Gold is also subject to the whims of the Stock markets.
As the DOW rises, GOLD falls. And so if today is a down day on the DOW, we could see Gold shoot up $20 and maybe even stop us out. You need tight management to withstand that volatility, and deep pockets to trade Gold. Some will disagree, but let's just say we'll deal with it here as a peculiarity rather than as a standard trade in a currency trading thread.
I am more interested in going through the method and technical setup than in actually achieving any secondary goal such as a profit. The primary goal is to conserve capital. Sticking to a method is one way of conserving capital in trading.
This morning (Australian time) the Sydney Gold market opened at $868.50 and traded ONE CONTRACT before moving to a NEW candle!!
It then traded 5 contracts in the first 5 minutes, and another 1 contract over the next 5 minutes. Clearly this price can not be believed!! Such a LOW VOLUME market is bound to be unreliable and volatile. Consequently, any attempt at a technical entry would be rubbish.
However, the method is screaming for an entry, and I dropped down to the 1H TF to see what's up. I found what I thought was a pull-back, and simply jumped in.
GOLD: Short
Open: $866.43 including spread of $1.00
STOP: $889.50 based on 1.5 times ATR
ATR was $15.38 so SL is (1.5 x 15.38) = $23.07
Stop = Open + (1.5 x ATR) = 866.43 + 23.07 = 889.50
Note that this ATR was calculated from the DAILY bars/candles because this is based on trading the DAILY ranges.
LEVERAGE:
My platform is the FxPro Demo, and I have it set at 100:1 for Mini trading lots.
Consequently, a $1 move in Gold will be worth $100 to my account, gain or loss.
Initially twe can expect the price to breathe a bit - and take notice that in DAILY bars, this can be about one third of the ATR under "non-volatile, trending conditions" which we are hoping for. If we don't get a smooth trend, then we have our Stop in place to protect from catastrophe. Gold can be costly to trade if you mess it up - have the stops there, or pay the price.
As I write, I have already taken the screen shots of the entry. But I have seen Gold rally by $3.67 since entry (on my FxPro data) and so my account was in the red to the tune of $367. Right at this moment, it is improving a touch, and I have negative $322.
I'll post this now, and continue with the plan of management.
Attachments
Ingot54
Well-known member
- Messages
- 403
- Likes
- 62
Gold has not done much - but regardless I will not be making any decisions or changes, other than to set a TP (Take Profit) order to take advantages of any serendipitous spike-downs that may occur while I am away from the screen. The new candle will begin in about 12 hours - so will review then.GOLD: Short
Open: $866.43 including spread of $1.00
STOP: $889.50 based on 1.5 times ATR
A $1 move in Gold will be worth $100 to my account, gain or loss.
Initially twe can expect the price to breathe a bit - and take notice that in DAILY bars, this can be about one third of the ATR under "non-volatile, trending conditions" which we are hoping for. If we don't get a smooth trend, then we have our Stop in place to protect from catastrophe.
I'll post this now, and continue with the plan of management.
Meantime I will set the TP to $850 which is just below an old support level.
In calculating the amount of margin to submit to my broker as surety for a failed trade, I have to know where my SL will be placed. In this case, the 23.07 SL equates to $2,307 margin requirement. This is 2.3% of my $100,000 account. If my risk on this trade was restricted to 3% or $3,000, I could have taken 1.3 contracts on Gold.
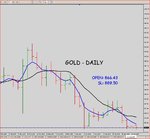
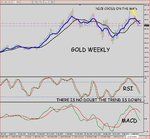
Attached are two charts - the WEEKLY tells me I am trading WITH the DOMINANT trend, which is SHORT.
The DAILY shows the level of TP and the current condition of the trade.
Not unhappy at all right now.
With best wishes
Ivan
Attachments
Last edited:
Ingot54
Well-known member
- Messages
- 403
- Likes
- 62
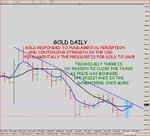
Update - 21st April 2009
If you are reading this (put your hands down now) it means you are still curious. But I don't blame you for feeling the method is a fizzer (and that decision has been made on ONE trade) because I would once have felt like this too.
But have a closer look at the chart attached:
a) We set our SL
b) It was not hit (yet)
c) The DOMINANT TREND is still down ... in the direction we are trading
d) Gold attempted a rally, and so far has NOT succceeded
e) The breathing space we allocated to the trade (ie 1.5 times ATR) has been proven sufficient - so far!
f) Fundamentally we are hearing of the USD being the strongest it has been for 30 days
g) The USD strength augurs well for our position - one of expecting Gold weakness
h) Strong Technical respect for overhead resistance - refer blue oblique line on chart below
i) So far the trade is still validated by Gold moving within expectant parameters
j) I expect Gold to retrace today to $876.50 purely on a 50% retracement of the entire move up.
k) All of the above could be blown away in 30 minutes by a sudden, volatile spike in price.
Now Gold is not a good instrument to begin a demonstration of trading, using any method, purely because its moves are based on too many other dominant markets -
* Economic news as opposed to the economy generally
* Price of Oil
* Geopolitical news and changes
* Strength/weakness in the USD
* The Gold SHORTING activities of JP Morgan Chase and Goldman Sachs
* Buying and selling of Gold by central banks
* Investor Sentiment
* ... and a host of other factors - you should see the picture - Gold is a special category no matter how you look at it
So even if Gold does have another up-swing today - unless it does eventually stop out, we will stay with the trade.
Now - to avoid the jitters we experienced over the past 24 hours, as the trade bounced our heads around, simply turn off the chart of Gold until this time tomorrow, and get on with finding another good trade somewhere.
Hands up those who have been following this thread and who now have serious misgivings?Gold has not done much - but regardless I will not be making any decisions or change ...
... Not unhappy at all right now.
With best wishes
Ivan
If you are reading this (put your hands down now) it means you are still curious. But I don't blame you for feeling the method is a fizzer (and that decision has been made on ONE trade) because I would once have felt like this too.
But have a closer look at the chart attached:
a) We set our SL
b) It was not hit (yet)
c) The DOMINANT TREND is still down ... in the direction we are trading
d) Gold attempted a rally, and so far has NOT succceeded
e) The breathing space we allocated to the trade (ie 1.5 times ATR) has been proven sufficient - so far!
f) Fundamentally we are hearing of the USD being the strongest it has been for 30 days
g) The USD strength augurs well for our position - one of expecting Gold weakness
h) Strong Technical respect for overhead resistance - refer blue oblique line on chart below
i) So far the trade is still validated by Gold moving within expectant parameters
j) I expect Gold to retrace today to $876.50 purely on a 50% retracement of the entire move up.
k) All of the above could be blown away in 30 minutes by a sudden, volatile spike in price.
Now Gold is not a good instrument to begin a demonstration of trading, using any method, purely because its moves are based on too many other dominant markets -
* Economic news as opposed to the economy generally
* Price of Oil
* Geopolitical news and changes
* Strength/weakness in the USD
* The Gold SHORTING activities of JP Morgan Chase and Goldman Sachs
* Buying and selling of Gold by central banks
* Investor Sentiment
* ... and a host of other factors - you should see the picture - Gold is a special category no matter how you look at it
So even if Gold does have another up-swing today - unless it does eventually stop out, we will stay with the trade.
Now - to avoid the jitters we experienced over the past 24 hours, as the trade bounced our heads around, simply turn off the chart of Gold until this time tomorrow, and get on with finding another good trade somewhere.
Attachments
Ingot54
Well-known member
- Messages
- 403
- Likes
- 62
Stopped Out ... Next Please!
OK - that's what we needed to see - every opportunity for the trade to breathe, but stopped out ... $5.50 higher than our stop.
I was wrong in my assessment that: j) I expect Gold to retrace today to $876.50 purely on a 50% retracement of the entire move up but that's trading.
The chart explains the rationale regarding the trade. We don't look back with any regret - we traded our plan.
We can, however, follow the trade over the next couple of days to see how close we were, and L-E-A-R-N from the wash-up whether we could have done better somewhere. What immediately springs to mind, is that we could take a look at the SL formula. Taking an arbitrary "1.5 times ATR" is rather whimsical. Why not 1.4 times ATR or 1.6 times? No reason at all.
We also need to be mindful of the fact that Gold could have kept rising, until it DID hit an even larger SL. No one would want that. So I think the adage "Cut your losses ..." is our lesson for the day, and be happy that we stuck to our plan. Trades that fail have the potential to really debilitate an account, and we played by sound guidelines.
Enough waffling. The Gold chart is now treated like any other - waiting for a setup, if we plan to trade it some time soon. We are really at a cross-roads with the chart. The two MA's look like they will either cross, or part-company without crossing, as the price falls further. We will need to check the closing price tomorrow to know that.
Meanwhile, we can be casting about for another setup - this time we will look through currencies for likely candidates. After scanning through, I am seeing too much volatility - for example, many pairs are showing "down" candles/bars yesterday, but "up" candles/bars today. Yet the MA crosses show trend moving opposite to today's price action. Therefore I am discarding them at this stage.
I did find one possibility, which I have decided to trade, simply because it lines up with our method, and our strategy will be the same as for Gold. There was spread of 19 pips on this pair as I opened the trade, though spread is fluctuating as low as 15 pips - luck of the draw I guess!
So here it is:
OPEN: 1.8163 (1.8144 plus spread = 1.8163)
Stop Loss: 1.7878 (ATR is 190 x 1.5 = 285 pips)
Take Profit: 1.8440 (well above recent resistance, so happy to take profit in any spike-up)
MARGIN DEPOSIT: With a SL of 285 pips, our margin requirement is $2850. This is within our 3% of account balance risk.
Account stands at: ($100,000 - 2703) = $97,693 with one live trade running.
We leave this trade now. No tweaking - no matter what happens in the market.
See you tomorrow.
STOPPED OUT AT $889.50!Hands up those who have been following this thread and who now have serious misgivings?
If you are reading this (put your hands down now) it means you are still curious. But I don't blame you for feeling the method is a fizzer (and that decision has been made on ONE trade) because I would once have felt like this too.
But have a closer look at the chart attached:
a) We set our SL
b) It was not hit (yet)
c) The DOMINANT TREND is still down ... in the direction we are trading
d) Gold attempted a rally, and so far has NOT succceeded
e) The breathing space we allocated to the trade (ie 1.5 times ATR) has been proven sufficient - so far!
f) Fundamentally we are hearing of the USD being the strongest it has been for 30 days
g) The USD strength augurs well for our position - one of expecting Gold weakness
h) Strong Technical respect for overhead resistance - refer blue oblique line on chart below
i) So far the trade is still validated by Gold moving within expectant parameters
j) I expect Gold to retrace today to $876.50 purely on a 50% retracement of the entire move up.
k) All of the above could be blown away in 30 minutes by a sudden, volatile spike in price.
Now Gold is not a good instrument to begin a demonstration of trading, using any method, purely because its moves are based on too many other dominant markets -
* Economic news as opposed to the economy generally
* Price of Oil
* Geopolitical news and changes
* Strength/weakness in the USD
* The Gold SHORTING activities of JP Morgan Chase and Goldman Sachs
* Buying and selling of Gold by central banks
* Investor Sentiment
* ... and a host of other factors - you should see the picture - Gold is a special category no matter how you look at it
So even if Gold does have another up-swing today - unless it does eventually stop out, we will stay with the trade.
Now - to avoid the jitters we experienced over the past 24 hours, as the trade bounced our heads around, simply turn off the chart of Gold until this time tomorrow, and get on with finding another good trade somewhere.
OK - that's what we needed to see - every opportunity for the trade to breathe, but stopped out ... $5.50 higher than our stop.
I was wrong in my assessment that: j) I expect Gold to retrace today to $876.50 purely on a 50% retracement of the entire move up but that's trading.
The chart explains the rationale regarding the trade. We don't look back with any regret - we traded our plan.
We can, however, follow the trade over the next couple of days to see how close we were, and L-E-A-R-N from the wash-up whether we could have done better somewhere. What immediately springs to mind, is that we could take a look at the SL formula. Taking an arbitrary "1.5 times ATR" is rather whimsical. Why not 1.4 times ATR or 1.6 times? No reason at all.
We also need to be mindful of the fact that Gold could have kept rising, until it DID hit an even larger SL. No one would want that. So I think the adage "Cut your losses ..." is our lesson for the day, and be happy that we stuck to our plan. Trades that fail have the potential to really debilitate an account, and we played by sound guidelines.
Enough waffling. The Gold chart is now treated like any other - waiting for a setup, if we plan to trade it some time soon. We are really at a cross-roads with the chart. The two MA's look like they will either cross, or part-company without crossing, as the price falls further. We will need to check the closing price tomorrow to know that.
Meanwhile, we can be casting about for another setup - this time we will look through currencies for likely candidates. After scanning through, I am seeing too much volatility - for example, many pairs are showing "down" candles/bars yesterday, but "up" candles/bars today. Yet the MA crosses show trend moving opposite to today's price action. Therefore I am discarding them at this stage.
I did find one possibility, which I have decided to trade, simply because it lines up with our method, and our strategy will be the same as for Gold. There was spread of 19 pips on this pair as I opened the trade, though spread is fluctuating as low as 15 pips - luck of the draw I guess!
So here it is:
OPEN: 1.8163 (1.8144 plus spread = 1.8163)
Stop Loss: 1.7878 (ATR is 190 x 1.5 = 285 pips)
Take Profit: 1.8440 (well above recent resistance, so happy to take profit in any spike-up)
MARGIN DEPOSIT: With a SL of 285 pips, our margin requirement is $2850. This is within our 3% of account balance risk.
Account stands at: ($100,000 - 2703) = $97,693 with one live trade running.
We leave this trade now. No tweaking - no matter what happens in the market.
See you tomorrow.
Attachments
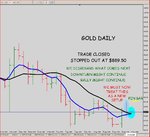
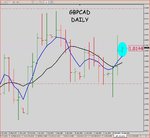
Ingot54
Well-known member
- Messages
- 403
- Likes
- 62
Trade Update - Faltering on Pound Weakness
Well - once again market volatility rules!
Although the trade still has a "life" of 60 pips approximately - depending on when you read this, I do not have much confidence in its success. However - the signal was given, and we stick to the plan, regardless of storm clouds or economic news boogies!
The Pound is in trouble on every front, and all currencies paired with the Pound are gaining against it. Consequently, in the absence of good news for the UK, I can only see this one also going through to the keeper. Nothing to do today but wait for the trade to fulfill its potential in our favour, or tell us we were wrong. Simple as that.
Now I can imagine some of you may be feeling that this method is a load of crock - and that may yet be the case 😱 😱
But I recall a senior member berating another member on another thread because "after 100 trades" he had achieved a certain win percentage. The senior member said that 100 trades was not enough to prove profitablity "in the long term" or that a 100-trade backtest was a poor sample - something to that effect. My point is that if 100 trades is hardly enough to test a method's veracity, then 2 trades would not even start your engine :|:|
Still - while I knew the Gold trade was subject to volatility due to all sorts of Fundamentals and worldly issues, I had expected the trade to get to at least Break Even for us. It was not meant to be - no one can tell the market what it should do.
Similarly with this GBPCAD trade - we didn't seem to get to first base, despite the trend getting the strong start that triggered the setup. Such is trading.
If the GBPCAD does go through to the nets, I will probably be a little more selective in future. The trades we took have indeed been legitimate, but probably could be put in the category of "hasty" because of my desire to find trades for us to follow through, and thus demonstrate the ease of operation of the method. A lesson that can be taken from this is that there is never any rush to find your trade. Even if you do miss the trigger candle, these trades run so far, that essentially the loss of one day's action means little in the scheme of profitability.
These trades can run to 1000+ pips in 3 weeks, and not only that - they can be added to carefully as they drive towards their "bend at the end!"
Thursdays are usually good days to find and enter trades - the week's pattern having been determined - but we shall see. For now I shall simply show you the chart, and have a look around. If a trade does look good for a setup, I will post it here within 30 minutes.
Otherwise ... see you tomorrow!
With Best Wishes
Ivan
I did find one possibility, which I have decided to trade, simply because it lines up with our method, and our strategy will be the same as for Gold. There was spread of 19 pips on this pair as I opened the trade, though spread is fluctuating as low as 15 pips - luck of the draw I guess!
So here it is:
OPEN: 1.8163 (1.8144 plus spread = 1.8163)
Stop Loss: 1.7878 (ATR is 190 x 1.5 = 285 pips)
Take Profit: 1.8440 (well above recent resistance, so happy to take profit in any spike-up)
MARGIN DEPOSIT: With a SL of 285 pips, our margin requirement is $2850. This is within our 3% of account balance risk.
Account stands at: ($100,000 - 2703) = $97,693 with one live trade running.
We leave this trade now. No tweaking - no matter what happens in the market.
See you tomorrow.
Well - once again market volatility rules!
Although the trade still has a "life" of 60 pips approximately - depending on when you read this, I do not have much confidence in its success. However - the signal was given, and we stick to the plan, regardless of storm clouds or economic news boogies!
The Pound is in trouble on every front, and all currencies paired with the Pound are gaining against it. Consequently, in the absence of good news for the UK, I can only see this one also going through to the keeper. Nothing to do today but wait for the trade to fulfill its potential in our favour, or tell us we were wrong. Simple as that.
Now I can imagine some of you may be feeling that this method is a load of crock - and that may yet be the case 😱 😱
But I recall a senior member berating another member on another thread because "after 100 trades" he had achieved a certain win percentage. The senior member said that 100 trades was not enough to prove profitablity "in the long term" or that a 100-trade backtest was a poor sample - something to that effect. My point is that if 100 trades is hardly enough to test a method's veracity, then 2 trades would not even start your engine :|:|
Still - while I knew the Gold trade was subject to volatility due to all sorts of Fundamentals and worldly issues, I had expected the trade to get to at least Break Even for us. It was not meant to be - no one can tell the market what it should do.
Similarly with this GBPCAD trade - we didn't seem to get to first base, despite the trend getting the strong start that triggered the setup. Such is trading.
If the GBPCAD does go through to the nets, I will probably be a little more selective in future. The trades we took have indeed been legitimate, but probably could be put in the category of "hasty" because of my desire to find trades for us to follow through, and thus demonstrate the ease of operation of the method. A lesson that can be taken from this is that there is never any rush to find your trade. Even if you do miss the trigger candle, these trades run so far, that essentially the loss of one day's action means little in the scheme of profitability.
These trades can run to 1000+ pips in 3 weeks, and not only that - they can be added to carefully as they drive towards their "bend at the end!"
Thursdays are usually good days to find and enter trades - the week's pattern having been determined - but we shall see. For now I shall simply show you the chart, and have a look around. If a trade does look good for a setup, I will post it here within 30 minutes.
Otherwise ... see you tomorrow!
With Best Wishes
Ivan
Attachments
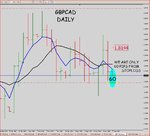
Well - once again market volatility rules!
Now I can imagine some of you may be feeling that this method is a load of crock - and that may yet be the case 😱 😱
But I recall a senior member berating another member on another thread because "after 100 trades" he had achieved a certain win percentage. The senior member said that 100 trades was not enough to prove profitablity "in the long term" or that a 100-trade backtest was a poor sample - something to that effect. My point is that if 100 trades is hardly enough to test a method's veracity, then 2 trades would not even start your engine :|:|
Ivan
Is 1000 trades enough, or 10,000 or 1,000,000 - who knows !! If some strategy is working i.e. making acceptable or even remarkable returns then there is no need to tinker with it. Equally strategies have to be given time to demonstrate their efficacy, particularly in position trading.
Only when the results indicate otherwise,is there a need to drop it or change it.
In any case money management techniques should kick in, in case of catastrophic failure.
Charlton
Ingot54
Well-known member
- Messages
- 403
- Likes
- 62
Thank you Charlton - fully agree.Is 1000 trades enough, or 10,000 or 1,000,000 - who knows !! If some strategy is working i.e. making acceptable or even remarkable returns then there is no need to tinker with it. Equally strategies have to be given time to demonstrate their efficacy, particularly in position trading.
Only when the results indicate otherwise,is there a need to drop it or change it.
In any case money management techniques should kick in, in case of catastrophic failure.
Charlton
As frustrating as it is to have the first two trades dip out on us, I am hoping some traders (merely curious or seriously seeking) are beginning to sense that there is indeed substance to this method. The method can actually be tweaked, but it leads to more whip-lash trades, and we really do not want that.
What we want is a method that establishes a trade along simple guidelines, then exploits the trend to the max. While it is not unusual to be whip-lashed in trading, it is not a frequent occurrence in daily and weekly chart trading.
We already have the method. What we need is the patience to cherry-pick the market at the correct junctures, and it certainly can be done - just a simply as scalpers cherry-pick the very short TF.
With Best Wishes
Ivan
Ingot54
Well-known member
- Messages
- 403
- Likes
- 62
Quick Summary
Tough I know - but that's the plan and that's the trade.
Taking a step back we can see that the GBPCAD has been muddling along almost horizontally for 3 months or so, in a range between 1.8430 and 1.7530.
While the bottom line is looking a bit buffed right now, we will take a break and not chase trades just for the sake of being in the market. Even had we remained in the trade, I seriously doubt the trade would have worked - it simply did not get on with it's promise with any conviction at all.
So far we are down around $4630 on 2 trades.
Next week will be an exercise in patience ... and profit!
So we were whipsawed out of the trade ... knocked-off by 42 pips!We already have the method. What we need is the patience to cherry-pick the market at the correct junctures, and it certainly can be done - just a simply as scalpers cherry-pick the very short TF.
Tough I know - but that's the plan and that's the trade.
Taking a step back we can see that the GBPCAD has been muddling along almost horizontally for 3 months or so, in a range between 1.8430 and 1.7530.
While the bottom line is looking a bit buffed right now, we will take a break and not chase trades just for the sake of being in the market. Even had we remained in the trade, I seriously doubt the trade would have worked - it simply did not get on with it's promise with any conviction at all.
So far we are down around $4630 on 2 trades.
Next week will be an exercise in patience ... and profit!
Attachments
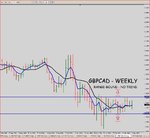
Ingot54
Well-known member
- Messages
- 403
- Likes
- 62
Reflections ... and Plans
We are sticking to the plan (though the market doesn't care about plans) and will be rewarded eventually. In hindsight, I think we have been attempting to trade early trends, but the market is telling us: "NO!"
How do we get "in tune" with markets, so that whip-saw activity doesn't destroy our account?
This is a perennial question asked by most traders ... and they are frequently told that only those who play probabilities and have an edge can hope to be consistent. But that is too broad for me - and I need specifics. That "answer" is unhelpful, a cliche, and basically useless.
So a specific answer is going to have to include information about finding a pair that is trending, and then picking the "right" opportunity to get into that trend.
If you check back to the chart in the post #36 I showed that the GBPCAD is actually range-bound in its WEEKLY time-frame. Consequently any moves are likely to be short-lived and prone to reversal. This is good news for traders in the 4H time-frame because they can find more turning points around the upper/lower Resistance/Support levels established. This method works quite well in the 4H TF but requires more time-input from the trader to manage the trades.
But unless we noticed the ranging activity (unfortunately I was too hasty and did not) we are going to be stopped out, or whip-sawed. I was looking at markets generally this week, and I noticed - more than usual - consecutive days of reversals. It was not just the GBPCAD that had an up-down-up-down daily pattern. The AUDUSD, and GBPCHF, GBPUSD, EURJPY, NZDUSD and GBPJPY have all had alternating up and down days for the week. Probably others as well - so as these moves unfold it is going to be harder or impossible to find a trend worth getting into.
The financial world is in turmoil. No one knows what to believe, who to follow, who has strength, who will emerge with dominance (or indeed wants to dominate anymore) and it seems like there is competition to see who will devalue their economies the fastest! Right now OIL has been removed from the equation. But just as we have "Gold Bugs" we also have "Oil Bugs" and they are lurking waiting to send the price of oil soaring once again. If that happens, it can only delay any economic recovery the Western world hopes to achieve - just a view. So it is nice, for the time being, not to have to consider the compounding influence of a volatile oil market. Sorry for those attempting to trade oil trends right now though. Copper is the success story in base metals. But we are digressing ...
The goal in trading is to move from the speculative to the probable, and in the process develop a business that is consistently profitable. I'll be candid here - I have not achieved this in my own personal trading, but I have discovered what works. Like many before me, I have been humbled by the markets (read: hammered into submission) because I thought I could "predict" what the market was going to do.
At this present moment I am reluctant to put any more serious money into the markets, because while I trust my method, I don't know when the current volatility is going to relent, and give us back the tradeable trends.
If, knowing this about me, you still wish to explore what we are trying to do, I welcome your interest and input. I know I will show you how to become profitable through trading longer TF - but we may need to be more patient until market conditions show us good/better setups and higher probability entries. They will come.
It's been a good week - we have seen how a trade unfolds. Importantly we have not become exuberant nor despondent, I hope. In fact as reality sets in that there is no easy money, I am hoping you are beginning to sense that to obtain the kind of profitability that can give you back your life - freed from the daily screen watching that threatens health and relationships - is boring.
Don't be disheartened though - as boring as succcessful trading can be, it still comes with rewards that exceed scalping, compared to the input of effort and time.
If you have followed my daily posts, you would be seeing that I set the trade and walked away. Then each day, as the new candle/bar began, I checked the trade and made a comment regarding the strategy to be followed as the trade revealed its direction. Again - we walk away. That's all there is to this method. Watching the trade several times a day can not only cause you to close it prematurely or move stops, it will rob you of ever learning to trust it.
While it is easy in its discovery, it takes patience, discipline and only average intelligence to succeed. We have not done anything seriously wrong, unless you hold me to account for not realising the GBPCAD is range-bound on its weekly chart. So if we are patient, we will soon uncover a trade that is made for us.
Thanks for being a part of this - please feel that your contributions, critique and suggestions will be accepted. I have here the very basics of a plan - and while I love its simplicity, it may be possible to improve it and still retain that. I have tried to trade with a minimum of indicators. I don't have objection to using a stochastic or a trend indicator if anyone wants to - it can only help. But what we don't want, is a complication that moves us away from simplicity to a focus on indicators.
As a nurse I find that the technology we now have is wonderful to use in assessing the physiology and well-being of patients. But at the same time, it is impotant to simply look at patients, talk to them, and get a feel for what is really happening in their health.
I think the same philosophy would serve us very well here - indicators are great, but what is the chart (price) really trying to tell us?
I leave you with the charts below - a good trend, but is it one we could enter on a pull-back?
Is it one we SHOULD be looking to enter on a pull-back?
Are we looking to trade with the trend?
What would cause us to consider an entry?
Hint: Check MONTHLY chart. There is a pin bar there with a range of 4,860 pips from October 2008. It is a wonderful signpost and still relevant. Although we do not use pure price action, this is an outstanding indication of a "top" in the rally at that time, and can not be ignored. Switch from Bars to Candlesticks and there is visible, an amazing large-bodied "shooting star" candle. This is followed the next month by a "hanging man" candle. That reversal duo is still influencing the market - or so it seems today.
In the absence of any other candle pattern signalling a bottom-reversal, one can only imagine a break of support is still possible.
If one examines the MONTHLY chart over the past 12 months, it is seen that 7 of the past 12 x monthly candles have respected the levels between 2.0050 and 2.0550. In the light of such strength at this support level, any breakthrough/breakout is likely to be powerful and decisive. But at some point it would be expected to re-visit the level, to confirm the break.
Now that is a long-term call indeed!
With best wishes
Ivan
Moving house means Internet disruption and a new ISP for me. So may not be able to show charts for a short time at some point.So we were whipsawed out of the trade ... knocked-off by 42 pips!
Tough I know - but that's the plan and that's the trade.
Taking a step back we can see that the GBPCAD has been muddling along almost horizontally for 3 months or so, in a range between 1.8430 and 1.7530.
While the bottom line is looking a bit buffed right now, we will take a break and not chase trades just for the sake of being in the market. Even had we remained in the trade, I seriously doubt the trade would have worked - it simply did not get on with it's promise with any conviction at all.
So far we are down around $4630 on 2 trades.
Next week will be an exercise in patience ... and profit!
We are sticking to the plan (though the market doesn't care about plans) and will be rewarded eventually. In hindsight, I think we have been attempting to trade early trends, but the market is telling us: "NO!"
How do we get "in tune" with markets, so that whip-saw activity doesn't destroy our account?
This is a perennial question asked by most traders ... and they are frequently told that only those who play probabilities and have an edge can hope to be consistent. But that is too broad for me - and I need specifics. That "answer" is unhelpful, a cliche, and basically useless.
So a specific answer is going to have to include information about finding a pair that is trending, and then picking the "right" opportunity to get into that trend.
If you check back to the chart in the post #36 I showed that the GBPCAD is actually range-bound in its WEEKLY time-frame. Consequently any moves are likely to be short-lived and prone to reversal. This is good news for traders in the 4H time-frame because they can find more turning points around the upper/lower Resistance/Support levels established. This method works quite well in the 4H TF but requires more time-input from the trader to manage the trades.
But unless we noticed the ranging activity (unfortunately I was too hasty and did not) we are going to be stopped out, or whip-sawed. I was looking at markets generally this week, and I noticed - more than usual - consecutive days of reversals. It was not just the GBPCAD that had an up-down-up-down daily pattern. The AUDUSD, and GBPCHF, GBPUSD, EURJPY, NZDUSD and GBPJPY have all had alternating up and down days for the week. Probably others as well - so as these moves unfold it is going to be harder or impossible to find a trend worth getting into.
The financial world is in turmoil. No one knows what to believe, who to follow, who has strength, who will emerge with dominance (or indeed wants to dominate anymore) and it seems like there is competition to see who will devalue their economies the fastest! Right now OIL has been removed from the equation. But just as we have "Gold Bugs" we also have "Oil Bugs" and they are lurking waiting to send the price of oil soaring once again. If that happens, it can only delay any economic recovery the Western world hopes to achieve - just a view. So it is nice, for the time being, not to have to consider the compounding influence of a volatile oil market. Sorry for those attempting to trade oil trends right now though. Copper is the success story in base metals. But we are digressing ...
The goal in trading is to move from the speculative to the probable, and in the process develop a business that is consistently profitable. I'll be candid here - I have not achieved this in my own personal trading, but I have discovered what works. Like many before me, I have been humbled by the markets (read: hammered into submission) because I thought I could "predict" what the market was going to do.
At this present moment I am reluctant to put any more serious money into the markets, because while I trust my method, I don't know when the current volatility is going to relent, and give us back the tradeable trends.
If, knowing this about me, you still wish to explore what we are trying to do, I welcome your interest and input. I know I will show you how to become profitable through trading longer TF - but we may need to be more patient until market conditions show us good/better setups and higher probability entries. They will come.
It's been a good week - we have seen how a trade unfolds. Importantly we have not become exuberant nor despondent, I hope. In fact as reality sets in that there is no easy money, I am hoping you are beginning to sense that to obtain the kind of profitability that can give you back your life - freed from the daily screen watching that threatens health and relationships - is boring.
Don't be disheartened though - as boring as succcessful trading can be, it still comes with rewards that exceed scalping, compared to the input of effort and time.
If you have followed my daily posts, you would be seeing that I set the trade and walked away. Then each day, as the new candle/bar began, I checked the trade and made a comment regarding the strategy to be followed as the trade revealed its direction. Again - we walk away. That's all there is to this method. Watching the trade several times a day can not only cause you to close it prematurely or move stops, it will rob you of ever learning to trust it.
While it is easy in its discovery, it takes patience, discipline and only average intelligence to succeed. We have not done anything seriously wrong, unless you hold me to account for not realising the GBPCAD is range-bound on its weekly chart. So if we are patient, we will soon uncover a trade that is made for us.
Thanks for being a part of this - please feel that your contributions, critique and suggestions will be accepted. I have here the very basics of a plan - and while I love its simplicity, it may be possible to improve it and still retain that. I have tried to trade with a minimum of indicators. I don't have objection to using a stochastic or a trend indicator if anyone wants to - it can only help. But what we don't want, is a complication that moves us away from simplicity to a focus on indicators.
As a nurse I find that the technology we now have is wonderful to use in assessing the physiology and well-being of patients. But at the same time, it is impotant to simply look at patients, talk to them, and get a feel for what is really happening in their health.
I think the same philosophy would serve us very well here - indicators are great, but what is the chart (price) really trying to tell us?
I leave you with the charts below - a good trend, but is it one we could enter on a pull-back?
Is it one we SHOULD be looking to enter on a pull-back?
Are we looking to trade with the trend?
What would cause us to consider an entry?
Hint: Check MONTHLY chart. There is a pin bar there with a range of 4,860 pips from October 2008. It is a wonderful signpost and still relevant. Although we do not use pure price action, this is an outstanding indication of a "top" in the rally at that time, and can not be ignored. Switch from Bars to Candlesticks and there is visible, an amazing large-bodied "shooting star" candle. This is followed the next month by a "hanging man" candle. That reversal duo is still influencing the market - or so it seems today.
In the absence of any other candle pattern signalling a bottom-reversal, one can only imagine a break of support is still possible.
If one examines the MONTHLY chart over the past 12 months, it is seen that 7 of the past 12 x monthly candles have respected the levels between 2.0050 and 2.0550. In the light of such strength at this support level, any breakthrough/breakout is likely to be powerful and decisive. But at some point it would be expected to re-visit the level, to confirm the break.
Now that is a long-term call indeed!
With best wishes
Ivan
Attachments
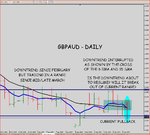
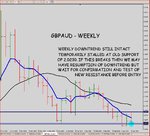
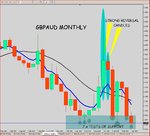
Last edited:
montmorencyt2w
Senior member
- Messages
- 2,619
- Likes
- 294
Ivan,
As usual, very thoughtful and considered.
Talking about oil however, I've been scaring myself witless reading Michael C Ruppert on the subject of "Peak Oil". In the long run, oil is only going one way, although by then, it may be too late to do any of us any good. We may have nothing to spend our "profits" on, and no means of spending them. It's a pretty grim outlook, one way or another, and a more immediate threat, perhaps, than climate change, although the two subjects are somewhat interlinked.
wackypete2
Legendary member
- Messages
- 10,211
- Likes
- 2,058
Now I can imagine some of you may be feeling that this method is a load of crock - and that may yet be the case
But I recall a senior member berating another member on another thread because "after 100 trades" he had achieved a certain win percentage. The senior member said that 100 trades was not enough to prove profitablity "in the long term" or that a 100-trade backtest was a poor sample - something to that effect. My point is that if 100 trades is hardly enough to test a method's veracity, then 2 trades would not even start your engine
Ivan
As I daytrader/scalper I've been on the losing end of as many as 7 trades in a row, so these 2 losses won't scare me, although I must admit I used a much lower lot size than convention would suggest. I thank you for posting your methods, good or bad. This does however highlight why my personal preference is daytrading to position trading. We may not have a winning trade for 2 or 3 weeks position trading. This is difficult for me to adjust to. I like to see the wins come a little sooner! I'm not in any way putting down your method or anyone else's, merely illustrating my preference any why. Rest assured I'm sticking with you for now. I want to see a winning trade in action!!
Peter
Last edited:
Ingot54
Well-known member
- Messages
- 403
- Likes
- 62
Hi WPAs I daytrader/scalper I've been on the losing end of as many as 7 trades in a row, so these 2 losses won't scare me, although I must admit I used a much lower lot size than convention would suggest. I thank you for posting your methods, good or bad. This does however highlight why my personal preference is daytrading to position trading. We may not have a winning trade for 2 or 3 weeks position trading. This is difficult for me to adjust to. I like to see the wins come a little sooner! I'm not in any way putting down your method or anyone else's, merely illustrating my preference any why. Rest assured I'm sticking with you for now. I want to see a winning trade in action!!
Peter
My "post" this morning got lost and didn't make it onto the boards, so here is the essence of it.
The chart below is a picture of what I see as the situation with the GBPAUD. All trends look to be down, and even though at the open for the week, the first bar looked like it wanted to rally, I still went short because the direction had not been established, and there was no reason not to follow this trend.
As it turned out, the pair rallied throughout the past 12 hours, and although getting closer to the open again, it has still not put us into profit. I will be looking hard at this at the close of the daily bar, in about 12 hours from now.
Usually I do not bother looking at the trade in-between entry and daily maintenance, but because I noticed my post did not appear ... here it is ... with update. I could just as easily not include this as a trade, but because I actually opened this in demo, I will be true to my views, and put it forward. There seemed to be little else at the open of trading to get excited about. I think this will change in a day or two.
If the trade does not get into a likely winning situation in 12 hrs, I may look at culling it to prserve capital. There is a difference between allowing a trade to get established, and foolishly throwing away capital on a bad trade - we will need to draw the line somewhere.
More humble pie - trading is never cut-and-dried!
Will be busy at times packing house for the big move, but will try to keep this updated on time.
Best wishes - and thanks for your interest and goodwill.
Ivan
Attachments
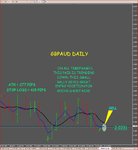
Similar threads
- Replies
- 5
- Views
- 5K