Getting a Life ... Position Trading the higher Time Frame

The chart below is a picture of what I see as the situation with the GBPAUD. All trends look to be down, and even though at the open for the week, the first bar looked like it wanted to rally, I still went short because the direction had not been established, and there was no reason not to follow this trend.

As it turned out, the pair rallied throughout the past 12 hours, and although getting closer to the open again, it has still not put us into profit. I will be looking hard at this at the close of the daily bar, in about 12 hours from now.

If the trade does not get into a likely winning situation in 12 hrs, I may look at culling it to preserve capital. There is a difference between allowing a trade to get established, and foolishly throwing away capital on a bad trade - we will need to draw the line somewhere.
Well another disaster in the making?

I have decided to allow the trade to run out its course. Although there is no telling where or if the price will turn, the original trends have not stalled sufficiently to indicate a reversal ... yet. It seems like it SHOULD reverse, but it is not possible to tell the market what it should do!:(

If we get stopped out today, I will cease contributing to the thread until we have moved house completely. This will give me a breather from picking unsuccessful trades - exactly what a trader needs to do if he is on a losing streak.

And it will give the markets opportunity to settle down from the erratic volatility that is smashing trends in the daily TF. Stepping back from the edge is always a good strategy after a series of losses.
 
Thread pause ... for now

Well another disaster in the making?

I have decided to allow the trade to run out its course. Although there is no telling where or if the price will turn, the original trends have not stalled sufficiently to indicate a reversal ... yet. It seems like it SHOULD reverse, but it is not possible to tell the market what it should do!:(

If we get stopped out today, I will cease contributing to the thread until we have moved house completely. This will give me a breather from picking unsuccessful trades - exactly what a trader needs to do if he is on a losing streak.

And it will give the markets opportunity to settle down from the erratic volatility that is smashing trends in the daily TF. Stepping back from the edge is always a good strategy after a series of losses.
Those who rated this thread 5-Star may now be thinking that judgement was premature.

I just wish to state that the idea behind the thread is still legitimate - it's just me who has been mis-reading my own method, and inadvertently ignoring other market principles.

As you can see in the attached chart, the GBPAUD is moving between Support of 2.0250 and Resistance of 2.0900. It has been doing this since around March this year. The strong downward correction that commenced on 21st April failed (again) to penetrate Support at 2.0250.

I will take a break now as I focus on moving house, and I can tell you I am really disappointed that in three trades I have been unable to show you one successful venture.

The method does seem to have some inherent weaknesses:

1) By the time a trade has broken through Support/Resistance levels, the MA cross has advanced and begun to mature. This explains how I was able to "jump in late" to the 9 trades I showed in post #4 and make massive profits (in demo remember). Consequently taking "confirmed" entries at the open of the first candle (trigger) after the signal candle, has been shown to be a premature action. Entering "late" seems to produce the better trades. Or, conversely, the current early entry is inadequate to safely exploit any edge we may have.

LESSON: Be prepared to allow the price to fully test Support/Resistance before attempting an entry. Look for a way to ensure pairs ARE trending before entry.

2) Whipsaw activity is leading to false moves. Even though the trades APPEARED to be breaking out at the MA cross, in hindsight this has been shown not to be the case. No breakouts occurred - they were fakes. In essence we are not looking for breakouts per se. We are looking to enter trends at their earliest beginnings, but to catch them early means we must be prepared to pay the price of failed moves.

LESSON: In order to get into trends early, we need to be sure that we are indeed in a new trend. We may have to introduce a trend indicator, or other way to confirm break from range-trading.

3) Volatile market activity leads to indecision by market participants. The movement of money is what alters price, but economic conditions alter value. Therefore while economic conditions are not giving clear direction, the money players are unable to seriously move price. Markets then move in a defined range, and totally disrupt trends.

LESSON: Identify range and drop down to a lower TF if wanting to trade. Stay out of the market while ranging conditions persist.

There are other refinements I could come up with - such as adding something like Stochastic and/or MACD and ADX. I like PSAR too, but frequently the signals come after too much has been given back.

Summary: I think it is far better to demo trade many more Daily setups in order to more fully expose weaknesses, and perhaps look back over time at "failed" setup/trades with prospective indicators added in. This will give a clue as to whether the use of the indicator would have either saved us entering a poor setup, or gotten us into a trade at a later (and thus safer) level).

I think we have been patient enough - that is not the problem. We have not been wildly selecting trades that did not correctly fit the criteria for entry. Rather, it is the entry criteria that needs refining, to filter trades that have a lower probability of "success."

Even though the three demo trades shown did not go on to make pips, I do not class them as "failures". I think we "succeeded" because we followed the plan. However, I truly was expecting a better strike rate, and not the reversals we saw immediately after entry.

I welcome comments by traders following the method. I am sure some of you saw trouble in the beginning, and were gracious enough to allow me the space to paint myself into a corner.

Even Miki256 warned I would get hurt in ranging periods, and I gave him a mouthful for his trouble. He was right. Very humbling for me to say that, and enough to motivate me to overcome the problem (both my pride AND the whipsawing)!

Finally, I hope traders who trade the 1H and 4H TF have been able to take on board the essence of this method. Had we been trading these TF the pip count may have been quite extraordinary, given the defined range the longer TF have established.

Any feedback or suggestions for improvement?

Thanks to the folk who pm'd me - I think if you keep in touch with what is happening on this thread, you will benefit, and if we can generate more interaction from readers, some decent refinements may develop.

With best wishes

Ivan
 

Attachments

  • GBPAUD_DAILY_29.JPG
    GBPAUD_DAILY_29.JPG
    126.8 KB · Views: 281
Last edited:
Moving a good idea into profit

Having settled into the new premises at Queensland's lovely Noosa, I think it is timely to revisit the thread, and see if something can be salvaged from what is basically a sound method.

Readers looking back over the thread can probably recognise that market volatility and whip-sawing has driven this method into a blind alley.

As a permanent night-shift Reg Nurse I find it difficult to trade shorter TF than the DAILY. Further, I usualy arrive home around 2400hrs GMT, so it is a perfect TF for me - the candles are closing at a time when I am able to make a decision, and can then leave the trades run.

But this has not been working out, as has been seen. The Forex markets have been as undecided as everything else. In recent days we have seen the EURUSD ranging between 1.39 and 1.42 - effectively trendless as far as daily action goes. Yet I have been calling signals as if they are the beginnings of new trends. These trends have not been materialising nor progressing.

Frustrating, because for me, this method has worked well previously, and I had hoped to be able to share something with the forum with some value.

Recently I bought a system called FPM and have been using it on demo with success. There have not been a great number of trades in the DAILY TF, and so I dropped down to the 4H TF. The trades triggered there have been very successful, and I have increased my demo a/c by about 16% in about 3 weeks. I could have done better, had I been able to monitor the 4H TF more frequently, but the previously mentioned occupational priorities prevent this.

It has served for one good thing though - I discovered that while the DAILY trends have not been getting underway very well, the 4H trends HAVE been very successful.

So ... in the next week of two, I hope to bring to the forum, the same strategy as espoused in the beginning of the thread, but operated in the 4H TF instead of the Daily TF.

I am not comfortable trading any shorter TF than the 4H, so if I can't show a decent profit trading the 4H then I will just leave it be.

I welcome input and ideas (positive) from others who can see where this thing is tripping up.

Cheers, and best wishes

Ivan
 
What is this new FPM system? It is not your original system. I therefore understand you will be using the FPM system on a 4h TF -- which is not a fair comparison as it would be a nonidentical method compounded with a different TF.

On the question of your original system/method: Have you done any investigation on optimum swing cycles for the respective market/trades? Clearly a misalignment in TFs would have been the suspected source of problems, irrespective of employed system. In many way, it is what position trading is all about.
 
What is this new FPM system? It is not your original system. I therefore understand you will be using the FPM system on a 4h TF -- which is not a fair comparison as it would be a nonidentical method compounded with a different TF.

Hi Cryoplasm

No - I will not be mixing the two systems. That may not have been very clear, because I switched from talking about the FPM system back to the one which is the subject of THIS thread. :oops:

I mentioned the FPM because it alerted me to the fact that Daily trends were less reliable (the way I tend to see them) compared to the 4H TF. It was only because of the FPM working well on 4H that made me think about trialing THIS system in 4H TF.

On the question of your original system/method: Have you done any investigation on optimum swing cycles for the respective market/trades? Clearly a misalignment in TFs would have been the suspected source of problems, irrespective of employed system. In many way, it is what position trading is all about.

Cryoplasm - I would welcome any suggestions - any!

This thread has been bereft of any input/suggestions from others - I kind of feel I wasted my time, to be honest, and was at one point considering allowing it to fade away into the sunset. I don't get much joy from talking to myself.

So yes - I really appreciate your interest. I know this method works - I have traded it succcessfully about 18 months ago. I recently trotted it out here to try to help traders who are having a tough time trying to scalp whippy markets. I am not sure what you mean by: "Have you done any investigation on optimum swing cycles for the respective market/trades?"

"Optimum Swing Cycles" is a bit abstract for me, but it sounds like identifying which part of a swing cycle we are in, and trading that in conjunction with the MA crosses. Correct me if I have a misconception about it. :help:

I was able to identify that I was trying to trade a pull-back from the main trend in one or two of my examples - doomed from the outset. Essentially I was going against the trend. To correct this, I really needed to zoom out a bit during my scanning process - regardless of the MA crosses. I think you have correctly called that "a misalignment of the TF".

Another thing I failed to detect was the onset of ranging behaviour and whipsaw activity. Both of these will kill a trend trader who is not prepared for the drawdown.

I am serously wanting to iron out the issues with this method, and as such I don't regard the method as my own personal property. But as with most systems, the basis of what might be a good idea needs a bit of tweaking.

What is this new FPM system? It is not your original system.

"FPM" stands for Forex Profit Monster. If you click on the link I added to my footnote, it will take you to a thread I have just started to deal with some trades using it. You could Google it, but to save you the trouble, it can be found here:

Online Trading System - Forex Profit Monster

That page explains it well - and I would advise readers to check all the clickable links to find clearer examples of it, as well as the author's blog. For the price (USD$49.99) it seems to be a much better value than some of the others currently being discussed for USD$1500. That's just an opinion because I clearly have not spent $1500 on any system - let alone 2 or three of them.

Anyway - that can be sorted on the other thread.

Thanks for your interest, and I hope we can get this method out of the bog, and back onto the fast-lane, where it can truly show some pace. :)
 
Apology ...

Cryoplasm - I would welcome any suggestions - any!

This thread has been bereft of any input/suggestions from others - I kind of feel I wasted my time, to be honest, and was at one point considering allowing it to fade away into the sunset. I don't get much joy from talking to myself.

I apologise for the above statement - that was not fair to the members who actually DID try to engage me in discussion about the method.

I am sorry - in fact there were several people who did contribute to this thread. :oops:

I had a look back at the beginning of the thread, and it is clear to me that I brok my own rules ... thus the high failure rate.

Taking just ONE trade - GOLD from post #28 - on the face of it, AT THE TIME - it looked like a good entry - the trend had been DOWN for 8 weeks.

But at this point, I ASSUMED I knew where the market was taking price. If you look at the chart of GOLD in post #28, you will see that all of the indicators I told readers I use in post #1 of the thread, are absent. Instead, I was using only the crssing of the MA's to effect an entry.

This was a FUNDAMENTAL error as far as trading using TA goes. If the rules of the method call for RSI, MACD, Stochastic to be in agreement with the MA cross, then that's what you need to have.

By choosing to omit these indicators from my chart, I missed a crucial element that not only would have stopped me selling GOLD RIGHT AT THE BOTTOM of the trend, it also caused me to miss a rally in GOLD.

I include the chart below that I should have been seeing. It is clear that the MACD had turned positive 6 days earlier, signalling the momentum to the downside had ended. In fact, had I seen the warning signal as described by the rules, and held off for JUST ONE MORE DAY, the indecision in other indicators (Stoch and RSI) and price itself would have been apparent.

Here is a clear example for all to see, of the kind of things traders have to overcome IN THEMSELVES if they wish to be successful. Unfortunately, while I have had success with the method in the past, familiarity breeds contempt, and I succumbed to thinking I knew better, and failed to diligently observe each and every rule for 100% compliance.

While no method can give 100% success all the time, my foolhardiness has given this method a far worse reputation than it deserves, and has added to the poor popularity enjoyed by many of the MA-Cross Methods.

The method is good - it just needs a good operator!:eek:

A look at the chart of GOLD from the period of that failed trade, and showing ALL indicators, will help e xplain the issue. I have a couple of charts saved from around the time of the failed GOLD trade, and a review of them confirms that ignoring the other indicators was the reason for the error.
 

Attachments

  • GOLD_A.JPG
    GOLD_A.JPG
    116.7 KB · Views: 287
Good thread Ingot, and your honesty about trading is refreshing.

I was going to ask where the indicators where on your charts, although I had assumed you were still using them but not posting them. A clear lesson in sticking to your plan and a clear example of how a few early successes can lead to a subconcious increase in risk appetite!

The Gold chart you post above shows how you should have avoided the failed short entry. But it also presents a possible long entry shortly after, where MA's cross and the indicators are showing positive. Would you have taken this one, or would that have been against the higher TF trend? And would the MACD crossover have heppened too early for this to be a suitable entry?

Keep up the good work Ingot, far more people read than reply.
 
Originally posted in Traderpedia: http://www.trade2win.com/boards/traderpedia/54928-position-trading.html

After searching for "Position Trading" I came across the post by thetopbloke, and didn't realise I was in the incorrect section to be posting a method of trading.

However ...

This is one of my fav subjects ... position trading. In fact I am completely baffled as to why traders spend so much time trying to make money scalping.

But that's understandable - I suck at scalping!

On the other hand, it could be because of my belief that no trader should attempt to trade FX unless they have managed to master at least 4H charts. I would recommend Daily charts for beginners - but that's me. Obviously people are doing very well through scalping techniques, going by the proliferation of threads covering that method of trading.

I hope one day to graduate to scalping, but it is a deadly environment for slow-wits like me.

Meanwhile - position trading!

I have a method I like to use that involves lagging indicators, though why we have to call them "lagging indicators" is beyond me - they ALL lag!

Set up MT4 chart as follows:

1) Price bars preferred to candles - own choice
2) 4-Period EMA
3) 10-Period SMA
4) RSI 14-Period
5) Stochastic 14,3,3
6) 2-line MACD (with or without histogram) 8,12,9

That is the basic template. I prefer no histogram on MACD as I am simply looking for the lines to cross. Remember too that MACD and Stochastic show different things, and for position traders these are helpful to our decision making.

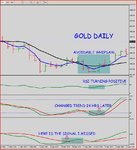
a) MACD warns us that a trend is beginning to gain momentum, or slowing.
b) Stochastic warns us that a trend is beginning or ending.

The other thing I use Stochastic for, is to tell me the STRENGTH of a trend. You may not agree with me, but for as long as the Stochastic remains above 80 in the "over-bought" zone, the rally will continue hard, and vice versa for under 20 in "over-sold zone." It's just one of the indicators that allows me at a glance to tell if my trade needs maintenance or not.

If Stochastic is above 80, and I am "long" then I don't need to be concerned for the health of my trade.

RSI is an "optional extra" - it's a personal choice, and to be candid, I rarely consciously use it. It can be used to generate confidence depending on whether RSI is already above its 50 line, or turning up from underneath its 50 line. Both of those conditions will mean different things to different traders. Some will wait until RSI DOES cross its 50 line before going "long." I don't - if it is turning up, and agrees with Stochastic, then I become seriously interested in a trade.

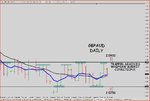
The attached chart is the current action in the NZDUSD.

This is a take-your-time trade - no rush, no errors.

But to trade this way you are far better to use LOWER leverage - less than 50:1 and to use stops based on 1.5 x ATR.

Have a play with the concept - I love it.

Other options are to have an additional 2 templates set up identically except for the MA's.

1) 2-Period EMA with 5-Period SMA
2) 6-Period EMA with 15-Period SMA

The fine tuning advantage these additional templates give, is a faster and slower cross respectively of the MA's, or a view of the relative positions of the two MA's. This is the same as looking at different time frames when trading with other styles.

Last comments:

Yes - the relationships hold true for other TF - eg 4Hour and 1Hour.
And no - I don't have the perfect exit for you. These are discretionary according to risk profile. If you are cautionary, you will exit on loss of momentum as shown by MACD, or on potential reversal as shown by Stochastic. My personal choice is to exit when the two MA's cross again, but not always ... sorry I couldn't be clearer about exit.

As I mentioned - I suck at scalping, so can not confirm their usefulness in that genre.

Good luck with it - shouldn't be need for too much comment, unless you wish to post your own nice trades.

Kind Regards

Ingot

Looks like a great charting setup; here are some suggestions to improve your Take Profit exits -
- Supports & Resistance levels
- Pivot Points (Metatrader has good one or I can give you improved version)
- Fibonacci extension levels
 
Top