GBP/USD 123's

Not a bad looking Daily chart in the EU. I have had a set up in about 6 weeks. Be nice to a shake out after all this price movement and then some nice ebb and flow! LOL
 

Attachments

  • 2010-08-11_EU_Daily123.png
    2010-08-11_EU_Daily123.png
    65.7 KB · Views: 166
Pipmaster, I just wanted to mention to you that I have benefitted from your thread. Personally, I am short cable, and look for a continued drop to 1.5278. I have been the benefactor of your thread by viewing the markets through a different set of eyes called 123. My methodology will always confirm my exits and entries, but it is through the eyes of the 123 that has exploited certain situations or opportunities that, otherwise, amy have gone unnoticed. I had a nice circa 120-pip win on the GBP/JPY that came as the result of the implementation of the 123 with my methodology. As of Friday, I entered the NZD/JPY at 61.23 (My MS1), but it was spotted because of a 123 formation that I had seen on the 15-minute chart. I willl be headed south with it to 59.83 (My MS2).
I did get the perfect bounce off the MS1, but it was in noticing the 123 formation that alerted me to that entry. After the 123 was formed, I followed price action as it backed up to 61.23, then perfected the entry. Thanks for your service! You get a 5-star rating from me.


4xpipcounter,

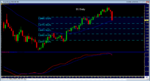
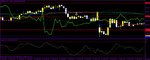
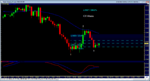
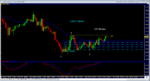
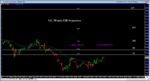
I see you also said that price maybe go going to 5720. Here is why I think that may be true. The 30 minute is where I start to look at the 123's and get an overall context, then I chase down where the next possible #2 will form, then there is the FIB chart that shows the FIB Sequence. General rule is when price closes over one FIB sequence line it has a high probability to go to the next line. I realize that the 13:00 candle only closed over the 55 FIB line by one pip but it looks like price is going to fall. So my bias is certainly bearish and my first target would be 1.5827. Doesn't mean I'm in short, but certainly means I'm not long!
 
Pipmaster, I just wanted to mention to you that I have benefitted from your thread. Personally, I am short cable, and look for a continued drop to 1.5278. I have been the benefactor of your thread by viewing the markets through a different set of eyes called 123. My methodology will always confirm my exits and entries, but it is through the eyes of the 123 that has exploited certain situations or opportunities that, otherwise, amy have gone unnoticed. I had a nice circa 120-pip win on the GBP/JPY that came as the result of the implementation of the 123 with my methodology. As of Friday, I entered the NZD/JPY at 61.23 (My MS1), but it was spotted because of a 123 formation that I had seen on the 15-minute chart. I willl be headed south with it to 59.83 (My MS2).
I did get the perfect bounce off the MS1, but it was in noticing the 123 formation that alerted me to that entry. After the 123 was formed, I followed price action as it backed up to 61.23, then perfected the entry. Thanks for your service! You get a 5-star rating from me.

I am really glad you have gained from my thread, and thank you for the compliments, very kind of you to say all that. It sounds like you are doing really well and making more and better trades than me....I'm a little short on chart time these days, so the pound is all I'm looking at now. I must say that you applying it to the GBP/JPY is very interesting to me. I spent about 18 months price action trading the GY, and with the way it moved the 123 system didnt seem to have the high probability that it does on the GU. However I didn't demo it but for a few months. I'd really like to hear more about your GY strategy! Have a good weekend! :cheesy:
 
First of all, I misled you slightly. This was an entry at 136.37, and I exited at 135.53, which is +84 pips. I made original mention of the trade from conceptual memory.
There was actually a double top formed just under that red line at 137.08, but I still qualified it as the 1 and 3. The 2 is the spike in the middle. I'll admit to being late on the entry, but I never got much of the bounce back, NOW. As it turned out, I got the entry during the sideways motion around the red line at 136.37. I got a bit of a nasty spike against me, but then came the move straight DOWN to the yellow line, which was my target at 135.53. Notice the bounce off that line. After that correction, I did get a 123 formation on the hourly, but was looking elsewhere while the formation on the GBP/JPY was going on. As it turned out, it could have been another perfect trade, as it headed to my next yellow line at 133.68.
I've found opportunities abound on many pairs, so it is just a matter of choosing what to go with at the moment.
Keep up the good work!


I am really glad you have gained from my thread, and thank you for the compliments, very kind of you to say all that. It sounds like you are doing really well and making more and better trades than me....I'm a little short on chart time these days, so the pound is all I'm looking at now. I must say that you applying it to the GBP/JPY is very interesting to me. I spent about 18 months price action trading the GY, and with the way it moved the 123 system didnt seem to have the high probability that it does on the GU. However I didn't demo it but for a few months. I'd really like to hear more about your GY strategy! Have a good weekend! :cheesy:
 

Attachments

  • gbpjpy trade.jpg
    gbpjpy trade.jpg
    84.5 KB · Views: 151
4xpipcounter

very nice. looks pretty cool, i think i'll start keeping my eye on the GY. I do have a question about your #2 point. Do you use the 40 EMA in the same fashion as I do to qualify your #2, or do you have another criteria for your #2??
 
I forgot what happened on the hourly at that time, but I did spot something on it which further qualified the entry, so the second part of the double-top still qualified as the 3. Of course, as a rule. the 3 has to be lower than the 1. That being the case, I was just looking for the lowest dip between the 1 and 3 to qualify as the 2, then I wait for price to break under it, and then get a hopeful correction, and then enter.
I admit to getting caught up by the 123 and distracted away from my own method. If that did not happen, then I would have entered as soon as price broke under the tenken and kijun, especially. That would have made for a more optimum entry.
The only MA's I use are the 200 MA, and that did not factor into this trading decision.
The red lines and the yellow lines are my weekly and monthly S&R's, respectively. They are proprietary and set before the respective time period. Another words, my weeklies will be ready to go by today at the Tokyo open, so the red lines will all be found in different places.
I respect your thread, so I hope that is not more information than you bargained before.

not at all, i'm always interested in other traders and how they trade, especially if it works for them! I enjoy talking about trading methods, never going to bother me talking about your method!!! so the more the better. :cool:
 
Eur/jpy 123 <>

Pipmaster, here's something I spotted on the hourly for the EUR/JPY. It looks like a 123 formation that could go either way. The red circles I drew are showing the possible 123 formation for a short, and the blue circles are for a possible long.
This is intriguiging to me. Personally, I favor the next major move to 108.59. The recent low gets broken, then we get a hopeful retrtrace, and then jump in for the ride south.
OTOH, if the blue 2 gets broken, then we are on our way to challenge the red 1. I love using the ichimoku cloud, because it also gives me a future tense of what to expect. The blue 2 could get broken, and then we would still have a formation for a 123 headed south. The cloud is bearish into the future. The candle will hit the top of the cloud by London open, yet still be under the red 1. If that scenario prevails, then the way I would trade it is wait for the candle to hit the top of the cloud, wait for the nexr cancle to break under the low, and then jump in. That would be a confirmation of the reversal. I think an excellent time to add on a position is to wait for the red 2 to be broken, get a retrace, then add another position, and then ride both to 108.59. I did not make room for it on this chart, but 108.59 is my yellow line, which is my MS2 (monthly 2nd support).
The latter scenario would be ideal, because the distance of the new red 3 to the red 2 would be about the same distance as the red 2 to the target. This whole thing could add up to getting a nominal gain on the UP, and then a nice big gain on the DOWN.
Structurally, and within the context of my methodology, the tenken is still well below the kijun, so if the candle hits the top of the cloud by London, then it could add up to a blowout.
That's what things appear. I do know I have 108.59 on the radar, so what I would look for is some sort of ideal entry point to make that happen. Looking through the eyes of your 123 adds a perspective that should only enhance any efforts if I make this trade, along with future trades.
 
Good stuff, nice to see you have it very clear in your mind on how you are going to handle price moments. You use a few things that I've never heard of or used. You should put up a pic of this set up, be cool to see. I did notice that you said that the ideal scenario has the same distance between the #3 and the #2 as between the #2 and the target. This is true but its is also true for every 123, since it is a symmetrical formation there is a certain measurement to them. There is more than one way to do it but the easiest way I've found is to take your Fibonacci tool and do a simple measurement from the #2 to the #3, then I turn off all the normal lines, like 50%, 61.8% and so on. Then I check the 200% line which gives me the target of that 123. Obviously 100% from the #3 point would share the same price as the #2 and another 100% would be the target, just the way I've found to draw it. Its amazing how once price breaks the #2 point how price really wants to go to the 200% line!!
 
The thing that legitimized the 123 in my mind was the overall and noticeable symmetry. If movements within the context of the 123 were arbitrary, then I would have questioned it, and probably just look the other way. Markets do follow a natural, symetrical ebb and flow. I believe all successful methodologies are constructed and operate within those tenants.
What you may have seen before but might have never used is the ichimoku cloud. It is the cornerstone of my methodology. The pride and joy of my methodology are my proprietary S&R's. Those are the blue, red, and yellow lines you see plotted on my charts. I also use the 200 MA and the stochastics. I use the stochastics as a momentum indicator, and the 200 MA as a warning of an impending bounce or a continuation.
I have many pics on my thread. The URL is listed in my signature. I also have a multitude of them on my blog at 4xpipcounter.blogspot.com. I have a complete tutorial on the useage of the ichimoku cloud, and another on the useage of my S&R's. I did that when we had an active chat room. If you want me to contribute something you feel may be of value to your thread ,then let me know what you have in mind. I just didn't want it to be a deterrant from your methodology without getting any concise input from you.
I know you use the Fibos in determining your targets and bounce areas. Similarly, I use my S&R's. They are predetermined before the period begins, and the accuracy is unreal. Watch for price action for the EUR/JPY at 108.59, and you'll get an idea of what I am talking about.
You are right that in using the Fibs how it moves 100% of the distance. This is why if we get a price continuation to the top of the hourly cloud, it is no surprise that 108.59 represents equidistance from 2-3 as it is 2 to the target.


Good stuff, nice to see you have it very clear in your mind on how you are going to handle price moments. You use a few things that I've never heard of or used. You should put up a pic of this set up, be cool to see. I did notice that you said that the ideal scenario has the same distance between the #3 and the #2 as between the #2 and the target. This is true but its is also true for every 123, since it is a symmetrical formation there is a certain measurement to them. There is more than one way to do it but the easiest way I've found is to take your Fibonacci tool and do a simple measurement from the #2 to the #3, then I turn off all the normal lines, like 50%, 61.8% and so on. Then I check the 200% line which gives me the target of that 123. Obviously 100% from the #3 point would share the same price as the #2 and another 100% would be the target, just the way I've found to draw it. Its amazing how once price breaks the #2 point how price really wants to go to the 200% line!!
 
Yeah that makes sense, I'll be sure to check your thread and blog. And feel free to post anything you want on my thread, we seem to think very close to one another and I'm sure I can benefit from your viewpoint and how you implement the 123's. I'm looking forward to seeing more of your method. To be honest I really want to have more trading opportunities, my 123 method is solid, my only wish is it would form up 2-6 times a month, but my criteria is tight which reduced the tradeable formations. My max risk is 5% and my typical return is 10%-15%, so only having 1 trade a month or one every 6 weeks is not all that great. I'm in the process of writing a strategy based on the FIB sequence chart and using a price action entry, the money management is a difficult with this one. If i can make it work then I think I could trade up to 4 times a month, maybe more, we'll see.
 
You're right. I think we do think very similarly in our views towards our trading. I think one of the big differences between us is you are much more careful in your approach, as is evidenced by finding 1 trade every 4-6 weeks that meets your criteria. I'm exactly the opposite. I get a sense of overkill because of the manifold opportunities that are presented. My platform constantly has trades running on it.
Just curious, why would you not want to hunt a setup on the 15-minute chart, or the hourly? That could yield more opportunities. Also, maybe you could consider looking at other pairs. From what I see so far a 123 is just that. It has worked on the GBP/JPY position I had, and it is now working on the NZD/JPY that I currently have up.


Yeah that makes sense, I'll be sure to check your thread and blog. And feel free to post anything you want on my thread, we seem to think very close to one another and I'm sure I can benefit from your viewpoint and how you implement the 123's. I'm looking forward to seeing more of your method. To be honest I really want to have more trading opportunities, my 123 method is solid, my only wish is it would form up 2-6 times a month, but my criteria is tight which reduced the tradeable formations. My max risk is 5% and my typical return is 10%-15%, so only having 1 trade a month or one every 6 weeks is not all that great. I'm in the process of writing a strategy based on the FIB sequence chart and using a price action entry, the money management is a difficult with this one. If i can make it work then I think I could trade up to 4 times a month, maybe more, we'll see.
 
I can relate to over trading, that was really why I never really saw results until the last few years. And as for the time frames I start with the 30 min to gain a sense of what price has been up too. Then I look at my 123 charts and look at the 40 EMA and see if there is any #1 and #2's forming up. My TF's range is the following: Daily, 12hr,8hr,6,hr,4hr,3hr,2hr,60min,30min,20min and 15min. So if there is a #1 point I'll change the TF to wherever the 40 EMA looks the best and has what could be a #2 point. I'm very picky on that #2 point, so I let a lot of price movement go by.

Market behavior has been a little off lately and the results seems to be no 123's for me. My thinking is that if I get a trade this week or next month and it is only a 15% or if the set-up is perfect and I can add a price action entry to it and make 50% then its worth the wait.
 
That is a good point. 15% compunded over 12 months equals 535%, which means a $10,000 account would grow to $63,500.
I try to keep those little facts straight when the occasional times come that I have a bad week or month.
Also, I think what makes you a good trader is that you are comfortable with your methodology and you know your restrictions.


I can relate to over trading, that was really why I never really saw results until the last few years. And as for the time frames I start with the 30 min to gain a sense of what price has been up too. Then I look at my 123 charts and look at the 40 EMA and see if there is any #1 and #2's forming up. My TF's range is the following: Daily, 12hr,8hr,6,hr,4hr,3hr,2hr,60min,30min,20min and 15min. So if there is a #1 point I'll change the TF to wherever the 40 EMA looks the best and has what could be a #2 point. I'm very picky on that #2 point, so I let a lot of price movement go by.

Market behavior has been a little off lately and the results seems to be no 123's for me. My thinking is that if I get a trade this week or next month and it is only a 15% or if the set-up is perfect and I can add a price action entry to it and make 50% then its worth the wait.
 
We are very different along those lines. I can't harldly go one day without putting up a trade, which makes us polarized along those lines. No one can argue either way. Anyone that makes 5 pips pe month is still in the upper 10% of all traders, considering 90% of them bankrupt their accounts.

Couldn't agree more! :)
 
Yep, I think you nailed it when you something your comment about being comfortable with your trading method. I think this is key, and if you are profitable with your method then you are above all the rest. Even though I'm only up 34% right now and God knows I'd rather be up a couple 100% but even at 34% in this global market place when most traders/investors seemed to be happy not losing their shirts, it doesn't seem that bad. Never know how much we'll be trading in 10 years!
 
Check out the FIB Sequence chart. I love this, it does this over and over again. Its based off the EMA's crossing. Very consistent. The 1st pic shows the move down, the 2nd pic shows the cross at the bottom and notice that price closed over the 89 FIB, price should be heading to 1.5738, the 144 Fib.
 

Attachments

  • 2010-08-17_FIB_Sequence.png
    2010-08-17_FIB_Sequence.png
    77.9 KB · Views: 188
  • 2010-08-17_FIBS_Seq.png
    2010-08-17_FIBS_Seq.png
    75 KB · Views: 173
Here is 60 min 123 that has formed up. Been a while since I have seen anything really close to a set...I wasn't at the charts when the #3 was formed! If price comes down and provides a price action I may take it. :clap:
 

Attachments

  • 2010-08-24_60min_123.png
    2010-08-24_60min_123.png
    63.6 KB · Views: 168
Still watching this 60 min 123. Price has almost broke the #2 point. If price does break the #2 point then I'll be waiting for a retrace and be looking for a price action buy signal. The Fibs chart makes this look really good as well. Everything looks to be going up, just need the retrace and a buy trigger!
 

Attachments

  • 2010-08-25_60_min_123.png
    2010-08-25_60_min_123.png
    66.3 KB · Views: 153
  • 2010-08-25_FIBS.png
    2010-08-25_FIBS.png
    70 KB · Views: 141
Top