OK So I am pretty much new therefore I have the privelege of being able to ask what are probably really dumb questions
So what I would like to know is what causes gaps in candle charts?
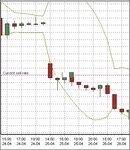
The attached chart is an hourly one but I have seen the same thing on 1minute candle charts (And once greatly benefitted from one too) The attached chart is actually about a 8% drop in a share value
My dumb question is how do these gaps occur - or rather by what mechanism do they occur
If the gap happens before a candle is even seen, how did a lot of traders suddenly sell a lot of shares causing the price to fall drastically, when no one could see the new ask price to buy those shares yet?
Rich
So what I would like to know is what causes gaps in candle charts?
The attached chart is an hourly one but I have seen the same thing on 1minute candle charts (And once greatly benefitted from one too) The attached chart is actually about a 8% drop in a share value
My dumb question is how do these gaps occur - or rather by what mechanism do they occur
If the gap happens before a candle is even seen, how did a lot of traders suddenly sell a lot of shares causing the price to fall drastically, when no one could see the new ask price to buy those shares yet?
Rich
Attachments
Last edited: