Best Thread FXCM/DailyFX Signals and Strategies

Breakout Opportunities Across Most Pairs

According to our DailyFX PLUS System Trading Signals, an important jump in forex market volatility warns that major currency pairs may see big moves in the week ahead.

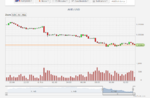
DailyFX 1-Month Volatility Index versus S&P 500 Volatility Index (VIX) 2011 - Present
forex_trading_high_volatility_japanese_yen_us_dollar_body_Picture_1.png

Such market conditions tend to favor volatility-friendly Breakout strategies across most pairs. The table below indicates which currencies seem more or less likely to see major volatility.

DailyFX Individual Currency Pair Conditions and Trading Strategy Bias
forex_trading_high_volatility_japanese_yen_us_dollar_body_Picture_2.png

It's possible to automate trades from the Breakout strategies on DailyFX PLUS using the Breakout 2 EA at FXCMapps.com.
 
AUD/USD is "Coiled Like a Spring"

DailyFX Strategist Jamie Saettele believes the Australian dollar is poised to break out.

eliottWaves_aud-usd_body_audusd.png

Triangles have formed from the July 2011 high (price is above that triangle line now) and the September 2012 high. Predicting the direction of the break is never a good idea but the latest pivot low can be used as a point of reference. In other words, stay bullish for an upside break as long as price is above 1.0485.

You can see Jamie Saettele's key technical levels for AUD/USD on DailyFX.com.
 
DailyFX PLUS Trading Signal: Buying USDJPY on a dip

The Optimal Entry strategy on DailyFXplus.com has just bought USDJPY at 89.905. The system recommends entering this trade at any price between 89.758 and 90.052. The 60-period Average True Range on the 12 hour chart is 0.587, so the stop loss has been set at 89.318 and the target has been set at 90.492.

fxcmdailyfxplususdjpy20.png

The signal was issued because our Speculative Sentiment Index was at -1.304, suggesting that the USDJPY could be trending upwards, while the price appears to be turning higher from oversold territory. The strategy looks for opportunities to buy when the Speculative Sentiment Index is below -1.22, and looks for opportunities to short when it is above +1.22.
 
Using Equities and Japanese Yen Correlations

Although US equity prices are near all-time highs, price patterns show a cluster of resistance while investor sentiment is at high levels. If these patterns are correct, then the S&P500 is at high risk of a significant sell off which could reach bear market territory of 20%.

Using_Equities_and_Japanese_Yen_Correlations_body_Picture_1.png

(Created using FXCM’s Marketscope 2.0 charts)

AUD/JPY tends to show strong correlations with the stock market. A reading close to 1.0 represents a perfect correlation. This means that if the SPX500 moves higher, then the AUDJPY tends to move higher. A reading near zero means there is no correlation between the movements of the AUDJPY and the SPX500.

Using_Equities_and_Japanese_Yen_Correlations_body_Chart_2.png

As the picture above notes, correlations don’t last forever. They move into and out of favor so we don’t want to rely on the correlation exclusively. However, we can use one part of the correlation to help us establish our longer term bias for the other.

Using_Equities_and_Japanese_Yen_Correlations_body_Picture_3.png

(Created using FXCM’s Marketscope 2.0 charts)

Jeremy Wagner discusses how to use these correlations to identify key levels of support and resistance in his article on DailyFX.com.
 
JPY, AUD, CAD Volatility Favors Breakout Trading

Impressive forex volatility in the Japanese Yen, Australian Dollar, and Canadian Dollar continues to offer strong trading opportunities.

DailyFX Forex Volatility Indices
forex_strategy_outlook_japanese_yen_volatility_body_Picture_1.png

Our volatility percentiles (shown in the table below) are almost all near 100%; forex options traders predict that volatility will be the highest it has been in at least 90 days.

DailyFX Individual Currency Pair Conditions and Trading Strategy Bias
forex_strategy_outlook_japanese_yen_volatility_body_Picture_2.png

Your capital is at risk. Past performance is not indicative of future results, but such highs in these options implied volatility-based indicators often coincide with outperformance in volatility-friendly strategies such as the SSI-based Breakout1 and Breakout2 systems on DailyFX PLUS. Both strategies are available as Expert Advisors at FXCM apps.com.
 
Trading the FOMC Interest Rate Decision

Time of release: 01/30/2013 19:15 GMT, 14:15 EST

Although the Federal Open Market Committee (FOMC) is widely expected to maintain its highly accommodative policy stance in January, the policy statement accompanying the rate decision may heighten the bullish sentiment surrounding the U.S. dollar should the central bank scale back its willingness to expand the balance sheet further.

Potential Price Targets For The Rate Decision
Forex_EURUSD-_Trading_the_FOMC_Interest_Rate_Decision_body_ScreenShot204.png

As a growing number of central bank officials take note of a more broad-based recovery in the world’s largest economy, the FOMC may strike a more neutral tone this time around, and the Fed may see scope to conclude its easing cycle in 2013 as the fundamental outlook improves.

Currency Analyst David Song provides his tips on how to trade this event risk on DailyFX.com.
 
SSI: Crowds Buy the Australian Dollar as it Tests Key $1.04 Support

SSI_2013-01-30_23624362_body_Picture_7.png

As AUD/USD tests support at 1.0400, the readings on the Speculative Sentiment Index (SSI) have flipped from short to long at 1.92. That means there are 1.92 long positions for every 1 short position. In other words, about 66% of retail traders are long.

SSI_2013-01-30_23624362_body_Picture_5.png

Yesterday the ratio was 1.71; 63% of open positions were long. Long positions are 6.5% higher than yesterday and 41.1% above levels seen last week. Short positions are 5.4% lower than yesterday and 37.7% below levels seen last week. Open interest is 2.1% higher than yesterday and 2.4% above its monthly average.

SSI_2013-01-30_23624362_body_Picture_6.png

We use our SSI as a contrarian indicator to price action, and the fact that the majority of traders are long gives signal that the AUDUSD may continue lower. The trading crowd has grown further net-long from yesterday but unchanged since last week. The combination of current sentiment and recent changes gives a further bearish trading bias.
 
Euro Break Higher Offers Buying Opportunities

Weekly Summary of Forex Trader Sentiment and Changes in Positioning
ssi_table_story_body_Picture_5.png

Retail forex trading crowds remain heavily short EUR/USD, and a contrarian view of crowd sentiment suggests further gains.

ssi_eur-usd_body_Picture_7.png

Trade Implications: An important jump in forex volatility favors further Euro gains, and the sentiment-based trading strategies on DailyFXplus.com have continued to buy EUR/USD.
 
Australian Dollar at Risk of a Surprise RBA Rate Cut

Fundamental Forecast for Australian Dollar: Bearish

The spotlight is on the Reserve Bank of Australia in the week ahead as policymakers gather for their first rate-setting meeting in two months. Economists’ forecasts and investors’ priced-in expectations suggest Governor Glenn Stevens and company will hold the benchmark lending rate at 3 percent this time around. The possibility of a surprise cut seems plausible however.

Forex_Analysis_Australian_Dollar_at_Risk_of_a_Surprise_RBA_Rate_Cut_body_Picture_5.png

While December’s rate cut was widely expected, another reduction this time around would catch the markets off-guard and is likely to weigh heavily on the Australian Dollar. A relatively dovish statement may likewise trigger weakness if it reboots speculation about additional easing down the road.

Aussie Breakdown Offers Selling Opportunities
ssi_aud-usd_body_Picture_12.png

Forex trading crowds have bought aggressively into Australian Dollar weakness, and a contrarian view of crowd sentiment leaves us in favor of further declines. A close below key congestion support at $1.04 would serve as confirmation of a major break lower.


Trade Implications: Our sentiment-based trading strategies have sold the Australian Dollar versus the US Dollar and Japanese Yen, but AUDUSD consolidation above $1.0400 has limited our enthusiasm for such AUD-bearish positions. We may need to see a substantive break lower to get aggressively short AUDUSD.
 
Breakout Identified in EUR/JPY

The Breakout Opportunities system from DailyFXplus.com has just bought EUR/JPY. The system recommends entering this trade at any price between 126.526 and 127.636. A stop loss has been set at the 24-hour low of 124.017 and a profit target has been set at the 1 Day ATR level at 128.457.

fxcmdailyfxtradingsigna.png

Breakout Opportunities is a breakout strategy that aims to catch the significant moves that typically happen when currencies break through technical support or resistance. The SSI-based breakout strategies tends to work well in volatile market conditions, generally when the DailyFX Volatility Percentage in a pair is above 75%.
 
Got the AUD/USD forecast right I see

Have you any relevent figures to show like P&L ?
 

Attachments

  • AUD-USD.PNG
    AUD-USD.PNG
    90.5 KB · Views: 917
7 Days' Worth of Rollover Interest in 2 Days

Upcoming holidays in Hong Kong, Japan and Turkey are presenting rare opportunities to earn up to 7 days' worth of rollover interest in just 2 days. Banks in Hong Kong will be closed next Monday, Tuesday and Wednesday. That means in addition to the normal Wednesday triple rollover that's available for trades open at 5pm New York time today, there are 4 days' rollover available for HKD trades that are open at 5pm this Thursday.

fxcmlunarnewyearrollove.png

From the Rollover Calendar on DailyFX.com​

Also, there will be 2 days' worth of rollover on JPY trades and 3 days' worth of rollover on TRY trades on Thursday.

fxcmrolloverrates.png

The FXCM Trading Station will show you the exact amount of rollover you can earn or pay for trades open at 5pm each day. The screenshots above reflect the triple rollover amount since it's Wednesday. That means tomorrow the rollover will be 33% higher for HKD (quadruple rollover), 33% lower for JPY (double rollover), and exactly the same for TRY (triple rollover again).
 
Got the AUD/USD forecast right I see

Have you any relevent figures to show like P&L ?

Hi Pat,

Below is an update on the AUD/USD trade that was opened by the Breakout2 strategy the other day. It is currently still open with a Limit at 1.0294 and a Stop at 1.0529. Note, there is a second stop level at 1.0414 which someone could use to move the stop to breakeven or to close half the position if they are trading multiple lots. The Momentum 2 strategy has also just opened a new short position at 1.03204 with a Trailing Stop at 1.0394.

fxcmdailyfxplusaudtradi.png

It's possible to automate the DailyFX PLUS strategies using EA's available at FXCMapps.com. I've included a screenshot of the latest Strategy Performance table which can be seen when FXCM clients log into the DailyFX PLUS website. Past performance is not necessarily indicative of future results. Your capital is at risk.


This window shows important statistics for each trading strategy. If you click on any strategy in this window, all the trade signals for that strategy will appear in the Trade Details window.

Strategy:
The strategy name.

Trading Style:
All strategies are grouped into Breakout, Momentum, or Range trading styles.

# Open Trades:
The number of current trade signals in each strategy.

Percent Wins and Avg Pips:
Accuracy Percentage is the percentage of all trade signals in the last 60 days that were executed as instructed by the strategy and accurately predicted profitable trades. Avg Pips is the average number of pips returned per trade in the strategy over the past 60 days. Both of these statistics are important, as some strategies may make many successful trades, while other strategies may make losing trades. Because these statistics follow the past 60 days only, different strategy’s statistics will change as market conditions change, as different conditions favor different strategies.


Let me know if you have any further questions.

Jason
 
Last edited:
Thanks Jason for your comprehensive answer. Good to see plus figures. Most brokers imho let their clients wither and die through lack of help. A short sighted view really when we can march onwards and upwards togethor. Of course there is the 5% who know what they are doing already.
I have a demo account at FXCM and should go live when it ends .

My pleasure, Pat :)

If you have any questions about your demo account, feel free to hit me up in our discussion thread.
 
Trading the News: Canada Net Change in Employment

The Canadian economy is expected to add another 5.0K jobs in January and the ongoing improvement in the labor market should prop up the loonie as it raises the outlook for growth.

Time of release: 02/08/2013 13:30 GMT, 08:30 EST

fxcmdailyfxcademploymen.png


Potential Price Targets For The Release

As the USDCAD pivots around the 78.6% Fibonacci retracement from the 2007 low to the 2009 high around 0.9910, we should see the long-term triangle continue to take shape, and we may see a move back towards the key figure should the data highlight an improved outlook for the region.

Forex_USDCAD-_Trading_Canada_Employment_Report_body_ScreenShot247.png

However, a dismal development should dampen the appeal of the Canadian dollar as market participants scale back bets for a rate hike, and we may see the dollar-loonie make another run at the 1.0100 figure should the employment report fall short of market expectations.

David Song provides more details on how to trade this event risk in his article on DailyFX.com.
 
USD/CAD Bullish after dismal Canadian jobs number

In my last post, I mentioned that a dismal jobs number out of Canada could lead to declines in the loonie. The report released today shows that Canadian employment dropped for the first in six months in January as hiring in manufacturing and education declined.

Forex_US_December_Trade_Deficit_Narrowed_USDCAD_Bullish_body_Picture_1.png

Following the data release, the US dollar jumped against its Canadian peer. As can be seen from the one-minute chart above, the USDCAD pair rallied to 1.0022 from 1.0004 and is currently trading higher at around 1.0029 and could target 1.0100 to the upside.
 
Shorting Early Week Strength in Yen Crosses

One of the big stories so far this year has been the steady rise in JPY crosses due to BoJ reflation. To start this week, however, senior currency strategist Jamie Saettele is eyeing opportunities to short these pairs in today's edition of Forex Trading and Technical Analysis Observations on DailyFX.com.

"The EURJPY, CHFJPY, AUDJPY, CADJPY, and NZDJPY carved out Weekly J Spike Reversals. As such, I'd like to short early week strength in Yen crosses."

EURJPY –240 Minute
Shorting_Early_Week_Bounce_in_Yen_Crosses__body_eurjpy.png

Past performance is not necessarily indicative of future results.

Levels of interest as resistance are 12556-12606 EURJPY, 10208/45 CHFJPY, 9628/55 AUDJPY, 9325/54 CADJPY, and 7819/48 NZDJPY.

AUDJPY –240 Minute
Shorting_Early_Week_Bounce_in_Yen_Crosses__body_audjpy.png

Past performance is not necessarily indicative of future results.

Of particular interest are EURJPY and AUDJPY but AUDJPY is probably the best play because of bullish technicals in EURAUD and bearish technicals in AUDUSD.
 
Yen Surges After G7 Clarifies Earlier Statement; USD/JPY Tanks

In my post yesterday, I mentioned technical analysis from Jamie Saettele on DailyFX.com that pointed to a potential selloff in JPY crosses to start the week. Today the fundamentals played nicely into this as comments from the G7 caused the Yen to surge and JPY crosses to tank.

USDJPY 1-minute Chart: February 12, 2013
Yen_Surges_After_G7_Clarifies_Earlier_Statement_USDJPY_Tanks_body_Picture_1.png

Past performance is not necessarily indicative of future results.​

A G7 official said the group is concerned about the excessive weakness in the Yen, and that recent Japanese policies would be a main talking point at the G20 meeting this week in Moscow, Russia. As a result, the USD/JPY cratered, falling from 94.25 to 93.25 in the span of 2-minutes.


fxcmdailyfxplustradings.png

Past performance is not necessarily indicative of future results.​

The Breakout Opportunities system on DailyFXplus.com just sold USD/JPY and recommends entering this trade at any price between 93.048 and 93.51, with a stop at 94.441 and a limit at 92.597. The signal was issued because the USDJPY has broken its 24-hour low while our Speculative Sentiment Index was at 1.32, suggesting that the USDJPY may have further to fall.
 
Trading the News: Euro-Zone Gross Domestic Product

The euro-area is expected to contract another 0.4% in the fourth quarter, and the deepening recession may drag on the single currency as it fuels speculation for additional monetary support.


Recent Economic Developments
fxcmdailyfxeurdata2013f.png

As the economic downturn threatens price stability, European Central Bank President Mario Draghi has certainly struck a more dovish tone for monetary policy, and we may see the Governing Council push the benchmark interest rate to a fresh record-low in an effort to encourage a sustainable recovery.


Potential Price Targets For The Release

We’re seeing the EURUSD struggle to push back above the 50.0% Fibonacci retracement from the 2009 high to the 2010 low around 1.3500, and the pullback from 1.3709 may turn into a larger correction should the 4Q GDP report fuel bets for another rate cut.

Forex_EURUSD-_Trading_the_EZ_4Q_Gross_Domestic_Product_GDP_Report_body_ScreenShot262.png

Past performance is not necessarily indicative of future results.​

Indeed, the bearish break in the relative strength index favors further downside for the euro-dollar, but a better-than-expected growth print may spark a sharp rebound in the exchange rate as it raises the fundamental outlook for Europe.

David Song discusses how to trade this event risk in his article on DailyFX.com.
 
Top