You are using an out of date browser. It may not display this or other websites correctly.
You should upgrade or use an alternative browser.
You should upgrade or use an alternative browser.
No apologies needed.bracke said:KJH
Counting the 3June I have 4 up days. Apologies if I am missing something.
Regards
bracke
I don't count a day up unless it breaks the previous daily high. June 4 was the first day (up) that broke a previous days high.
I found that when I change to this approach market momentum and trends became much clearer (for me at least)
Another example if I may...May 20 I don't count that as a day down for possible trending purposes even tho the market closed much lower. It was an "inside day", that closed down. My first day to start counting for a trend would start May 21 cause it broke the daily low ( and then went no where !)
Look at, if you will, as I noted in the post earlier, 3 days up verses 4 days down to identify where the market momentum / counter trend strength is or isn't.
Look to May 4-May 5th, 2 days up swiftly taken out by 2 days down when May 7th broke the low of Apr 30th.
Another...Apr 27 to May 4 low. 4 days down took out 6 days up. Count back from Apr 23 high.
( Apr 26 isn't part of the count as it didn't break a daily hifh or low)
Does this make sense ?
Helps get me on the right side of momentum moves....
Your thoughts ?
KJH
ps. Once a daily high or low is broken and a count is started I then include inside days. And yes, outside days get tricky--until the direction is resolved and that usually happens in a day or two...
Hooya
Why was 4449.2 a pivot point?
KJH
Thank you for your reply
Yes it makes sense....just. My trading is a lot less complicated than your own ( I appreciate that it is not complicated to you ) I don't try and read events as far of as you do or analyse in the same way.
I am still trying to master support/resistance and understand the volatility of the US markets.
iainpw
I am long and was waiting for approx 4470 but it has failed to arrive, perhaps those nice Americans will push up their markets and we will follow.
Regards
bracke
Why was 4449.2 a pivot point?
Bracke I dont want to sound ungiving but pivot points are on many sites and in many books. Reckon you should be reading those. There is a lot to learn but you will learn more than just asking a question on here. Its probably better to read about things and then if you have questions fire away.?
There are hundreds if not thousands of websites for traders out there with all the info. have a look at this one re pivots
http://www.traders.com/Documentatio...tracts_new/Gopalakrishnan/Gopalakrishnan.html
Hooya
Thank you for your reply and the link, you are not being ungiving rather the reverse and I appreciate your patience in answering my questiions which must be a little irksome at times.
If I ask a question which you think I should get elsewhere say so, I will not take umbrage.
Now another question!!!!!!
There appear to be a number of methods of determining support resistance levels eg pivots, fibonacci, visual viewing of chart and I have no doubt there are others. Do they usually coincide and which ( if any ) have you found offer the best result.
Regards
bracke
best sources of s and r
1st Previous Price...i.e look left for old support resistance and keep an eye on those
2nd Fibs very good to keep an eye on.
3rd Pivots imo are very good intraday especially the actual pivot point. But some dont think so. Its a personal thing
1st Previous Price...i.e look left for old support resistance and keep an eye on those
2nd Fibs very good to keep an eye on.
3rd Pivots imo are very good intraday especially the actual pivot point. But some dont think so. Its a personal thing
Bracke...If I may...
Re: Pivots,
I find the 50% level of the previous days range very important, especially if it was a larger than normal range. If the market can't get past this I expect the prevailing daily trend to resume until it's broken.
I then switch to the 50% level of the previous 2 days and so on.....
I monitor all the FIBs only cause that is what a lot of other folk are looking for, so I need to be aware of them.....
Hope this helps.....
KJH
john joachim
Junior member
- Messages
- 10
- Likes
- 0
Pivot Point
ALSO YOU CAN USE
www.stelaronline.com-resource-pivot.htm
JOE
Hooya said:when you say 50% KJH you mean the mid point between yesterdays high/low. Correct?
ALSO YOU CAN USE
www.stelaronline.com-resource-pivot.htm
JOE
YesHooya said:when you say 50% KJH you mean the mid point between yesterdays high/low. Correct?
Hooya
Thank you for your reply
KJH
You appear to monitor a lot of factors. I would be surprised if they all line up together at the same time to give a totally + or - indication, so how do you trade with all the information ie what is the priority you give to the information.
Regards
bracke
Thank you for your reply
KJH
You appear to monitor a lot of factors. I would be surprised if they all line up together at the same time to give a totally + or - indication, so how do you trade with all the information ie what is the priority you give to the information.
Regards
bracke
[KJH
You appear to monitor a lot of factors. I would be surprised if they all line up together at the same time to give a totally + or - indication, so how do you trade with all the information ie what is the priority you give to the information.
Regards
bracke[/QUOTE]
We'll there really is only about 30-40 mins worth of review prior to the open, yes I cover 8-10 points daily in this review. This gives me a feel for daily expectations basis the daily chart.
Intra day I overlay S&R, fib retracements and then the market either confirms my expectations or not. I am slow to change intra day if the exact opposite of what I expect occurs unless it
( market action) is with the established trend --then I go with it.
I use mainly momentum moves to enter ( higher lows--lower highs) on a 2 min time frame and the 5min as my bigger picture for intra day trading with S&R and fibs as mentioned above.
DO I get it wrong--OFTEN !
but i use tight stops cause I'm either right quickly or I'm out of there.
That is for intra day stuff.
If I'm position trading, the same review above applies..I sjust move my stops out to where the market shouldn't go if I'm right....
Regards,
KJ
john joachim
Junior member
- Messages
- 10
- Likes
- 0
KJH
You may have answered this already but if you position trade the dow how far out do you set your stops?
I have great problems with dow volatility taking out my stops and then reversing - most frustrating.
john joachim
Success, gained access - a usefful calculator, thank you
Pivot Point for dow 10,348, just showing my new found understanding!!! I can hear the murmours now ,first it's gaps now its Pivot Points, best just humour him he might go away - but I won't.
and I have closed my long trade at 4454, I know that you were all waiting with colonic anticipation for that announcemount.
Regards
bracke
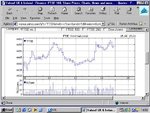
On the attached chart there are 2 large rises and largish volumes at 1.30.
It's as if the intention is to push the ftse quickly through the 4450 level.
1 Is my observation correct?
2 Is it to get past the pivot and/or psychological level?
3 Are there likely to be repercussions ie a pullback below the 4450 level?
Regards
bracke
It's as if the intention is to push the ftse quickly through the 4450 level.
1 Is my observation correct?
2 Is it to get past the pivot and/or psychological level?
3 Are there likely to be repercussions ie a pullback below the 4450 level?
Regards
bracke
Attachments
leeshindig
Active member
- Messages
- 140
- Likes
- 0
Hi all....
I noticed some of you had mytrack problems yesterday (as did i with AIQ)...
so thought I would take the opportunity to post a link to my website...it has live ftse charts...not as advanced as mytrack but live all the same for back up.....
lots of other stuff like news,historical csv data,pivot calculator etc....
hope you can find it of some use.....
http://www.livecharts.co.uk/FTSEchartpage.htm
http://www.livecharts.co.uk
Lee.
Similar threads
- Replies
- 1
- Views
- 1K