bracke said:KJH
Why would you not be surprised by a false break?
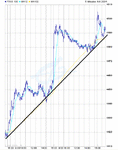
Well, after such a big consolidation on a daily chart my observation has been that the market will break one way for a day or two then get back into the consolidation and then head the other way. Of course it doesn't have too but I'm always wary of it.
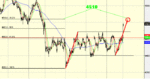
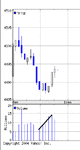
Presently, (EOD) we have a nice move to the upside. 4500 ( pyscological) and 4510 ( fib Ret) are resistance. We also now have a gap between 4460 and 4480 that all eyes will be on to be filled. One little upset on the world scene and we will be back at the bottom of the consolidation or lower imho.
I don't know about LSE volume but NY volume was low last night considering the move up in point terms on the Dj, Nas etc. As an example the volume on 03-06-04 with -67 point move down on the Dow was greater than yesterdays +148 point move up on the Dow.
May be the volume specialists can help me out here with that interpretation ??
Does any one know where daily LSE volume can be obtained ?
Thanks
KJH
You are using an out of date browser. It may not display this or other websites correctly.
You should upgrade or use an alternative browser.
You should upgrade or use an alternative browser.
KJH
London IMHO is appalling in its lack of consistent volume data. The FT prints volume each day, but it has has voids on occasions, it also includes SEAQ intl (foreign stocks traded in London).
Finance.yahoo gives FTSE100 volume if you select historical data for the index.
Bloomberg (internet) gives volumes for FTSE100, FTSE250, FTSE Allshare, but only on the day. If you miss the day you have lost the volume data.
Mully....Do you always look at the volume to backup what your seeing in the prices ? how reliable is the volume data that you use ?
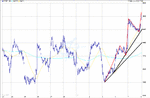
I can see the failed break on the 1 minute chart @4503 ish so that would be the position to go short.
The only problem i've been using 5 min charts and the only clue to go short is a shooting star.
Think i'll have to start using the 1 min charts to refine my entries a bit.
Nevermind, put it down to experience and another lesson learnt. No doubt there will be more chances to get in today.
Iain
iainpaw.
As you may know I try an keep things very simple.
Price action, trendlines(demand and supply)
Support/Resistence
and 1 hour/1day SMA to remind me the actual trend of market (stops confusion)
Volume is always watched but only used when its helps in analysis
"Focusing on price and volume doesn't mean analyzing every single bar pair. Nor does it mean obsessing over the volume trend. A lot of people, for example, think that volume has to be consistently rising in an uptrend that's not the case. As long as price is rising, the demand/supply equation is working in your favor, regardless of what the volume is doing. It's only when you begin to see shorter bars and longer tails and little Trend Line breaks that you need to become concerned. And if volume doesn't come in accompanied by a higher price, then you may have a problem. If volume does come in and price just sits there, then you're looking at distribution, and you may want to say bye."
hen its helps in analysis
Mully - Thanks for the quick lesson on volume.
So do you trade off 1 min charts ? - or should i say do you look for better entries/timing on the 1 min chart whilst looking at other timeframes for confirmation.
I could only see a short on the 1 min chart this morning that i would have taken but the 5 min had a shooting star which was the only indication and not enough to trade off.
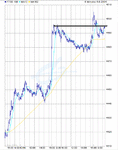
As i'm writing it seems the earlier support @ 4495 has now become resistance ????
So do you trade off 1 min charts ? - or should i say do you look for better entries/timing on the 1 min chart whilst looking at other timeframes for confirmation.
I could only see a short on the 1 min chart this morning that i would have taken but the 5 min had a shooting star which was the only indication and not enough to trade off.
As i'm writing it seems the earlier support @ 4495 has now become resistance ????
Volume
Just been looking at the volume - the only problem is the volume on Mytrack doesn't resemble the volume shown in the Yahoo chart. The spike this morning is much the the same as the others, in fact all the volume bars are more or less the same value.
Maybe i need to adjust my settings on Mytrack or the data isn't too good - anybody any clues ???
Hooya......On the 5 min the retest doesn't show up that easily because it is all contained in a couple of bars which is difficult to spot without going to the 1 min charts.
Iain
FTSE today
Very little movement prior to the Greenspan speech this afternoon.
Have hedged my 4 UK long positions: Man group (EMG), Xstrata (XTA), Matalan(MTN), Forth Ports (FPT) 1:1 yesterday with FTSE mini-futures as a counter short position.
Am watching Johnston Press (JPR) for possible upward breakout and Cairne Energy.. anyone trading these are have an opinion? :|
Similar threads
- Replies
- 1
- Views
- 1K