FTSE 100 - May

"how can the index be contolled to give such a level" I would guess it comes down to money and volume. Volume is light intraday with most volume coming at the begining and end of day. If there is a big seller at 4425 who is going to buy the index to get it above there. You might need big pockets depending how big the seller is. Also visible resistance will also play apart. .if traders see that 25 is resistnace again you have ask yourself who wants to buy at resistance after 100 point decline...not many I would guess.
 
Last edited:
Bracke,

Back again

re how can markets be held.

Temporary equilibrium of both buyers and sellers

Large sell/buy orders can temporarily hold markets until they are absorbed.

Eventually they will be overwhelmed by the overall market direction

Edit

I see Hooya has already replied.
 
Hooya

Filling gaps - are you saying that when the price jumps up or down traders who might have traded at prices in the gap will not trade untill the price returns to the gap. therefore marketmakers will manipulate the price to get it back to the gap?

Positions are taken by traders who because they think/know that the market wants to fill the gap will trade in the direction of the gap and set their stops at the outer limits of the gap to maximise profit?

Regards

bracke
 
mully

I find it odd that the price can be contolled so closely, its as if the buyers and the sellers are acting in concert.

Regards

bracke
 
basically yes but I would lean more to saying that its not the traders wanting to trade at a particular price but its more the mm'ers wanting to see if there are anyone who wants to trade at those missed prices.
 
99.99999% but how quickly is the question. :)

they are not something to be traded on their own but just say you have a long signal at 4485 tomorrow you can at least have the confidence that you are likely to see 4498
 
Bracke,

Markets exist to facilitate trade.


Markets are not controlled as such, but logical trading can give the impression of "control."

Here is one explaination.

If there is a temporary large imbalance in orders,
an intelligent way of making sure the order is absorbed
is to feed in to the market ( ie not sell/buy all at once).

As an example, a seller could have left an order to sell at 4425, good till complete.
Every time the market moved up to that area it would trigger the seller.
As long as the seller was bigger than the buyers it would halt the advance.
(Giving the impression that there is an unseen blockage/wall)
Eventually, if the buyers take all the seller's stock and have still more demand,
the "apparent block" will disappear and the "more buyers than seller" will prevail.
 
Nice clear signal day

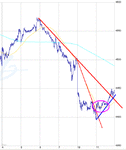
1) FTSE100 breakline from yesterday broken at open

2) FTSE100 then traded above its 1 day SMA

3) Tested the SMA and managed to stay above

4) Ran back and tested new blue beak-line at the same time MACD went positive

5) Broke the major red break-line to confirm change of trend
 

Attachments

  • chart.gif
    chart.gif
    13.6 KB · Views: 149
My lambourghini chart didnt get too many comments today considering it is a proved pattern and worked out near perfectly.

But as Mully keeps saying "keep it simple" so I have re drawn the chart again but with out price on it...as you see all it was just two (three if you count the low) support resistance lines. Makes you think eh! :rolleyes: :LOL: :cool:
 

Attachments

  • Lines.GIF
    Lines.GIF
    24.9 KB · Views: 170
Hooya,

I think people thought your "lambourghini chart" was some esoteric TA analysis, and way beyound their analysis/comprehension.
 
Seriously,
:idea:

If we are posting to help ourselves and others, then i think we should keep it simple, so as to emcompass the widest potential audience. Otherwise, we risk confusing rather than informing.

To quote a famous theorem
"Non sunt multiplicanda entia preater necessitaem"
 
Hooya

1 I don't understand your comment about long signal at 4485 ---- likely to see 4498.

2 Lambourghini Chart - what is it, and don't tell me its the way to your purchase of a Lambourghini!

mully

We dont all speak french you know!

Regards

bracke
 
Well I think the posters are clever enough to spot a symetrical pattern when I post one nothing more. and the car reference is only because the shape the pattern takes...but i think most got that..I hope :)
 
Bracke,,

You tease...

It is Occam's Theorem

Entities should not be multiplied beyond necessity
 
Hooya

Lambourghini Chart - as Captain Mainwaring would say - s t u p i d b o y!

mully
occams theorem appears to be a reverse of the holmes theory, when you have eliminated the probable consider the improbable, or words to that affect

Thank you both for your assistance.

Regards

bracke
 
Hi
I see you guys made some money today

Mully
can I add just one thing ?

the successful test of the fib at about 10 seemed to be important .
it all started from there.

the a/d never went below 60 all day - absence of sellers !!!!
they may be back about 4470 ?
 
Mully,Bosai and co.
There is some good TA stuff coming out from you lot, together wth some good humorous comments.
Mully. I have now decided to go along with your suggestion and use ten minutes charts and am using 8and 34 sma's.These suit my style,thanks.
I can't keep away from this May thread,got told off by "her indoors" for not mowing the lawn to day,ive made some dosh though.lol
 
Crude Oil over $40.

I hope you are aware that crude oil is trading over $40

July Crude 40.13/21
 
Top