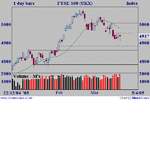
FTSE 100 - March 2005

oops, sorry gulli missed your post first time round. What made you change your tune from downward pressure to 4500 - just trying counter trend or looking for the day trend?

peter - are RSI and mas key for you in terms of your rules or just minor confirmations?

good trading

jon
 
Hi Peter,

In view of the strong turnaround in dow towards at end yesterday, I may just about b/e on Monday. If I do, I shall stay on the sodelines, unless I spot a good opportunity.

As always,Peter, your posts are most helpful - thank you. I am still a relative newbie, are you able to recommend any good quality courses? I do not mind paying - at least I will start to get better understanding of entry and exit levels.

As always, good trading,

best regards


G
 
Barjon,

I am still bearish, but I saw DOW go up by a 15-20 points and FTSE had not moved. Got 'greedy' thought there will be 5 points in footise for m, was I wrong! This is my momentary loss of focus and weakness (greed).

I am still learning and do not have any basis to forecast 4500. But, I was pretty sure of 4930 all my earlier posts referred to 4930.

As I am a learner I posed a question re training to Peter, are able to offer any views on that for me?

As always, Barjon, good trading

kind regards


Gull
 
barjon said:
peter - are RSI and mas key for you in terms of your rules or just minor confirmations?
jon
Hi BJ

Nothing is 'key' really - Holy Grail remains illusive and accurately estimating the odds a constantly changing work in progress :(

I've started using some Jurik Research indicators in place of regular RSI, MA's (Inc MACD) and ADX/DMI. Finding them quite impressive.

Frankly I find regression analysis among the most useful in terms of 'setting' the scene' , so-to-speak, for a trading session. With most indices, if the price moves to 2+ standard deviations away from a high confidence statistical mean, you can be pretty damn sure its going to revert on a reasonable timeframe- just a solid reliable way of confirming and testing a trend. It's facinating to watch the regression line confidence level change intra-day as each bar prints too - gives you additional 'feel' for changing trend - But it's price that rules :!:

Also all the usual s/r + fib retracement/extension, EW etc. It's never-ending.

Still can't trust the mechanical stuff though, so it remains a constantly developing art for me. Have to say that 2005 is looking pretty rosy so far though (profitability that is, not forecast - market or otherwise ;) )
 
gullible said:
.... are you able to recommend any good quality courses?
Sorry - can't really recommend any. I've been on a few myself over the years. Can't say any were a rip-off, but neither were they revelatory, and none stands out as being fundamental in terms of my own trading repertoir.

I'd simply say search out information, soak it up like a spong and make your own judgements about it . There's bags of it out there on the web - much of it free. You could do worse than trawl the archives here too - particularly the Knowledge Lab.
 
gullible said:
As I am a learner I posed a question re training to Peter, are able to offer any views on that for me?
Gull

Gulli

Can't improve on Peter's reply, trawling through T2W will get you a long way - and for free :!:

Have you gone through the entire Basics of Trading thread http://www.trade2win.com/boards/showthread.php?t=4629 . It's full of good stuff and post 337 page 34 which takes you through as if real time is particularly excellent.

good trading

jon
 
Gentlemen,

Still few days to go before March end. The thread has gone quite and I am suffering from withdrawal symptons.

Anyway, my Friday's long came good today. I was out like a shot at B/E+1pt. Shall now watch for any shorting opportunities, unless of course there is an upward trend.

As always, good trading.

Gull
 
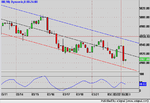
I'm still working with those same old channels. The DC within the August UC is now close to 90% confidence with price tracking it's lower boundary and close to the main channel lower boundary too - and it's seven weeks old! The 90 min chart channel is now nearly 3 weeks old and over 90% with price currently bang in the middle of it. All my indicators say a little more downside is likely, especially the daily MACD which, whilst oversold is still pointing quite steeply down. The others are flattening at extremely oversold, suggesting a bounce soon. So how much further down before a bounce and how big a bounce?

If I knew that I'd clean up. And of course today's US FOMC statement and rate setting at 7:15pm our time could cause major gyrations if not EXACTLY as expected.

With that caveat my best guess - We're due a bounce (as is the DOW). Markets are apprehensive and continuing to discount possible further bad news from the US. So, if the news is more or less as expected, then Footsie should bounce from no lower than about 4900 - how high? Smallest normal fib retrace would take us to 4970, so that's what I expect.

I still think the market is a short much above that level though.

That's my current mindset - but it ain't cast in stone.
 

Attachments

  • ftsed22-3.png
    ftsed22-3.png
    102 KB · Views: 168
  • ftse9022-3.png
    ftse9022-3.png
    98.6 KB · Views: 160
Last edited:
Further to my last Bump’n’Run setup post, the FTSE made an attempt to retest the highs as predicted, but found resistance at 5040ish making a lower high in the process and bringing out the bears…..

I don’t see a supportive bottom yet on RSI and post Fed, I notice that the FTSE futs are around 4900 this evening…….

But as Peter has suggested, the index may make a technical bounce off of the ‘run’ trendline which is coincidental with the lower downtrend channel/flagline……

Watching closely....... :cool:
 

Attachments

  • 22-03-05.gif
    22-03-05.gif
    20.7 KB · Views: 175
mmm, three indecision candles in a row. 2 abortive tries at north and todays failed try south on the highest volume of the three. Be interesting to see how it holds against the DOW's - 100 or so since ftse close. A fairly big gap opening south, then a rise throughout or then a give up the ghost further fall? Tomorrow will tell all.

good trading

jon
 

Attachments

  • ftset.gif
    ftset.gif
    9.8 KB · Views: 181
Price is testing the lower boundary of the August channel for the first time since the start 7+ months ago - another sign that we are in for a serious test of that trend. The MACD signal line has turned negative for the first time and the main line is parallel to it and close behind - which says there could be even more downside before a bounce. Other indicators are preparing for a bounce. There does appear to have been a sea change in the US too, with pretty well all the bench-mark indices looking tired. In fact there's a feeling that FTSE is very reluctant to sink lower, but that signals from the US are just too compelling to ignore (after all, markets are in the business of discounting the forseeable future are they not?

However, on a one week view from 4900 I think there is more upside than downside potential. Not enough for me to break my shorts-only rule though - so I'm on the sidelines again for now.
 

Attachments

  • FTSED23-3.png
    FTSED23-3.png
    134.2 KB · Views: 169
  • FTSE903-3.png
    FTSE903-3.png
    69.6 KB · Views: 148
peterpr said:
In fact there's a feeling that FTSE is very reluctant to sink lower, but that signals from the US are just too compelling to ignore (after all, markets are in the business of discounting the forseeable future are they not?

However, on a one week view from 4900 I think there is more upside than downside potential. Not enough for me to break my shorts-only rule though - so I'm on the sidelines again for now.

peter

With you on all that. For my ftse 100 shares swings, all my longs are closed off now and a few shorts are in. Because of the fall, of course, I've got a cluster of potential swing lows appearing and if they start getting confirmed that may indicate a bit of northwards. I'll still need ftse above 5006 to change me from favouring shorts though.

good trading

jon
 
Bottom picking is a dangerous game for trade entry purposes (likewise top picking). However, here's some more 'evidence that we are close to a short-term bottom. From the low of 12th Jan to the high of 21st Feb, price has touched the 61.8% fib retrace line this morning. If that does prove to be the ST low, then a bounce to 4940-4980 ish is indicated. Otherwise 4850ish here we come before serious support.
 

Attachments

  • FTSEd23-3-2.png
    FTSEd23-3-2.png
    99.7 KB · Views: 194
  • FTSEd23-3-3.png
    FTSEd23-3-3.png
    94.3 KB · Views: 166
Further to post 74

The 4 week decline from 5063 to yesterday's low amounts to @ 3.5% and is the longest and biggest decline since the August up-trend began. Even if we are witnessing a trend change (and I believe we probably are), then a retrace of some of that decline is a high probability move. So how might such a retrace unfold and what are the likely levels?

At present price remains just inside the main channel - having tested it yesterday. It is also just inside the 4 week down channel having touched its lower boundary yesterday too. It could of course break down though both, steepening what is to date a fairly shallow DC but, both volatility and swing periods over the past 12 months and more say that is unlikely before a bounce.

Is it worth trading?

Well, even if it does not bounce until major support at 4850ish, a .25 retrace would mean a break-even trade from here. Much more likely, IMHO, is a .25 - .382 retrace from about yesterday's low for 30 - 50 points (ie 4940 -4970 ish) - maybe more.

The only real counter indicators are the continued downward slopes of both MACD and RSI, albeit with the RSI approaching O/S and the MACD just breaking the zero line and flattening.

On balance, I'll probably wait until after the holiday for a little more confirmation before looking to trade it. BUT OTOH ;)
 

Attachments

  • FTSEd24-3.png
    FTSEd24-3.png
    109 KB · Views: 212
peter

Can you remind me how your channels are established and drawn please. Ta.

jon
 
barjon said:
peter
Can you remind me how your channels are established and drawn please. Ta.
jon

BJ

Regression line with +&- 2 standard deviations for the channel. The start is arbitrary. I just go looking for lines that have a Pearson's R value as high as I can find over 10 or more bars. I use 'Pearson's R' simply because it is standard with ESignal - its just a more complex (advanced?) version of correlation coefficient. Also the calculation of the regression line can be based on various combinations of OHLC. Not that they make that much difference when you are watching for changes to the 'R' value with each succeeding bar. As always their usefulness is largely a matter of judgement.
 
Top