FTSE 100 - April 2005

barjon

Legendary member
Messages
10,752
Likes
1,863
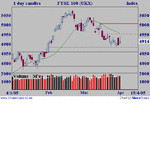
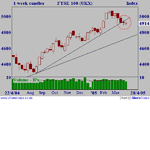
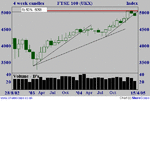
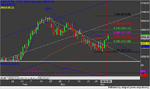
Into April and the bears footprints have begun to appear on monthly and weekly as well as being out in force on the daily. Little relief in sight as yet (particularly after DOW close) but the two dojis on the weekly do point to indecision.

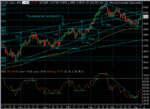
Maybe those dojis also reflect the prevailing mood seems which seems to be a desire to rise continually thwarted by Wall Street weakness - Thursday and Friday action shows it well. Maybe buyers holding off rather than significantly increasing selling pressure?

Anyway it'll go where it goes. I'm still favouring shorts.

Good trading

jon
 

Attachments

  • ftse.gif
    ftse.gif
    10.4 KB · Views: 340
  • ftsw.gif
    ftsw.gif
    9.2 KB · Views: 369
  • ftsem.gif
    ftsem.gif
    9.4 KB · Views: 336
Haven't got a call for this week on Footsie. Like BJ I favour the short side and I'm restricting myself to shorts on anything other than intra-day plays on the LIFFE June futures contract.

In spite of everything, that August up channel is still pretty much intact at over 94% confidence though, as is the down channel from Mid February at 91% ish - in other words can't make its mind up what the hell to do. Price has played around at the lower boundary of both for six trading days, so something should change shortly. Funny thing is, more immediate upside to around say 4970 would maintain both channels at over 90% - but it can't go on for ever - can it? :eek:

Indicators say market is considerably oversold, but after Friday's action in the US we can expect a big downside gap at the Monday open at the very least. Fib retrace lines shown assume this short cycle low is in but may be a bit more yet before some retrace at least - say to 4950 ish if you fancy a fairly low risk long after Monday's gap down :?:

Personally I won't be looking for another swing trade until the position is a little clearer - and it will probably be a short.
 

Attachments

  • FTSE3-4-05.png
    FTSE3-4-05.png
    135.4 KB · Views: 351
Peter, Barjon,

I am still shorting, I know DOW tried to rally today, but does not seem to be a convincing rally.
 
Interesting that Prudential are getting back into equities,while Barclays are looking at bonds and commodities-both overvalued imho-but of course it'ds not their flippin' money is it? These wine quaffing loss monkeys get paid just for turning up and being.....well, smug.
 
Interesting indeed. Commodities seem to be on a relentless upward trend, China, India, Brazil and Russia are often cited as reasons behind the trend. Equities, I don't know down a fews weeks, up a few weeks, down agisn, up again, just make best of any intraday volatility.
 
I think one of the major problems is hedge funds. A couple of months ago, I counted 28 FTSE 100 constituents that were supposedly about to be bid for. These guys are getting pretty crafty. Most of the hedge fund managers are ex investment bankers, thus are well aware of institutional holdings. They put about a spurious takeover story and use the associated rise in share price to reverse a long position into a short one. I even know of one private equity firm, who was considering bidding for a FTSE 250 company who received a very well reasoned (anonymous) letter telling them why they should not bid. The letter almost certainly came from a hedge fund with a huge short position.

Taking yesterday as an example, the FTSE 100 was well up on ALLD bid news. However SCTN, DGE, SAB Miller were up strongly too. Looking at the market today, it is down 2-3 despite the Dow futures being up 20 points, and spread betters forecasting the market to be up 8.

My point is, to understand, the volatility of the FTSE, it is not Life companies like PRU or LGE, that you should look at, it is hedge funds
 
Footsie has broken above the February down channel after a serious and extended test of the up channel from last August. It touched the 50% retrace line from the 5th April low to the 21st Feb high this morning and is testing the resistance of the 50DMA right now. In other words we don't have a confirmed intermediate trend change - yet.

So just how much strength is there? Of my indicators the daily MACD is the most bullish - everything else is a bit mixed - especially on the 60 - 90 minute charts where they are already overbought after the 100 point climb from Monday's low, so we could see a bit of dithering here. A re-test of the August channel upper boundary would take us to 5200 + on a normal cyclical timeframe - and sentiment seems to argue against that right now. Looks like it could be shaping up for another go at the January highs though.
 

Attachments

  • FTSE7-4-5.png
    FTSE7-4-5.png
    123.9 KB · Views: 234
Looks like it could be shaping up for another go at the January highs though.

Yes, I agree Peter – if we have a confirmed bull flag, the immediate flag height target is to equal the January highs; the target of the flag + ‘pole’ is 5175 imho……
 

Attachments

  • 07-04-05.gif
    07-04-05.gif
    22.6 KB · Views: 209
From a non technical perspective, I would point out that the LIFFE exchange was down for most of yesterday, so the market might have been a bit distorted.

There is no question that SHEL and to a lesser extent BP had a disproportionate effect on the market too -particularly on low volume. That said NYMEX crude dropped sharply after the close by about $1.70.

The spreadbetters are suggesting we will be up 10. I would be surprised. I suspect, other things being equal, we will struggle to hold gains, mainly because of oils being down.
 
So far this morning price has bumped up against both daily and monthly R1 pivots with the weekly just 4 points or so higher. It has also come within about 8 points of the .618 fib retrace of the down run from 21st February. So - some significant. hurdles just ahead if the index is to surge up to retest the year's highs.

I've no idea whether it will test those highs again. I do know that 118 points straight up in less than 4 days after a 200 point decline in 28 days probably calls for some sideways / consolidation at least. My view is that to retest those highs will require continued high momentum though. If momentum wanes I don't see it clawing it's way painfully upward toward new highs, more likely an abrupt reversal to confirm the two month long promise of a medium term trend change.
 
james6848 said:
Phew - that was some gap this morning...

Certainly was - but no more than expected after Friday's US close and Far East performance leading up to Europe opening.

The technical damage done to most of the Bellweather stock indices in the US ytd is severe. My view of the outlook for equities is as bearish as ever on a 12 month view but, from a day trading perspective is good to see volatility increasing everywhere. Doesn't bode well for the economy as a whole though with increasing signs of a US recession - hence UK/World - looming.

Any views on how long it will take to fill that gap then?
 
peterpr said:
Any views on how long it will take to fill that gap then?

Well, as a newbie I would say that the gap will be filled relatively quickly to around 4900 over the next few days as we see some bargain hunters come in - not to say that this will last though.

As I write there seems to be a base forming that suggests the downward drop is decelerating. Of course, the fly in the ointment is what will happen when the US markets open.

Let's see how wrong I am...
 
up we go from here on :)

wonder if it might be worth a binary bet to finish up today...... buy at 2.6???

looks like the down move is pausing for breath.

a R:R of 40/1 has got to be worth a punt lol...

might be giving it some to get there though..

fc
 
james6848 said:
Once it manages to break through 4835 it will have a rocket up it's ass.

This is a technical term that has eluded me, is it related to 'rocket science' or cruelty to animals?

Regards

bracke
 
Last edited:
Top