Forex strengthmeters - the basics

NVP

Guest Author
Messages
37,934
Likes
2,141
Welcome All!

Please note: if you have been directed here from the FXCORRELATOR.COM website... this thread will give you a grounding on what I do .......feel free to ask questions on here or my other threads at T2W.

Well, after nearly 10 - 11 years of fooling with these things now and having achieved a very long-running thread elsewhere at T2W on the same subject (toooo many posts to read now for most humans on that one.... :eek:)

....plus my more Humble thread at FF (more like the SS re the rules there ?:p) and some really cheesy youtube videos at my FXcorrelator channel ......(spielberg still hasnt called me)...and my damn website that I can never seem to get up and running re service provider/malware issues ........(i'm working on it !)

its finally time to go back to the basics and help the many beginners and interested traders who dipped their toe into that epic thread over the years and then ran away confused and screaming (....join the club ? :p)

This thread will go back to the basics and build slowly....and based on the time I can commit to it ..........it will also help me as its always good to go back to the start and revisit all the things I now take for granted ......no stone unturned ;)

I am also hoping it will help me strip back some of the things I do as (like all humans and traders) my life seems to revolve around adding layers of complexity .....(why why ?? !!! :whistling)

I also confess I see so much junk out there re Strengthmeter indicators (with silly charges and Fees attached to them and the secrets to be shared) .... I just wanted to provide some basics that will save you some money wasted (or at least get you a little more streetsmart in those decisions).........

ok give me some time to think .........I've launched the Thread to MAKE me start creating posts here .....if I dont start I wont ever do it :sneaky:

first posts by/during the weekend

meanwhile if anyone has questions on strengthmeters or things they want to discuss put them here ...and I will try to add them into the mix ....but basically it will be simple building blocks of information

PS - the other thread will continue on its ever winding path as usual and if you are really lucky the Jedster will pop in as well.........

Neil
NVP
 
Last edited by a moderator:
Hi Neil,
. . .its finally time to go back to the basics and help the many beginners and interested traders who dipped their toe into that epic thread over the years and then ran away confused and screaming (....join the club ? :p). . .
As a member of staff and long time member of the site, I'm well known by many members for a number of things!
:p
Chief amongst these is that I admit I know next to nothing about the forex market and have never traded it. So, you can use me as a guinea pig. My interest in forex (and this thread) is that I'm sure if I can develop a better macro view of the market as a whole, it will inform my decisions about the one I like and trade: U.S. equity indices, primarily the Dow.

. . .meanwhile if anyone has questions on strengthmeters or things they want to discuss put them here ...and I will try to add them. . .
So, first forex newbie question from me: what is a 'forex strengthmeter' - how are you defining it and how does it help your trading?
Tim.
 
Last edited:
This Thread will not cover intermarket correaltion .......thats a huge subject

this will cover the uses of the simple and humble Forex Strengthmeter .....no more no less....

I will load some examples/origins of this tool.....but please trust me when I say the version available below (first line) in the signature area is a generically decent version/representation of most strengthmeters out there (both free and many with charges attached:cool:) ....

N:smart:
 
Last edited:
Hi Neil,

As a member of staff and long time member of the site, I'm well known by many members for a number of things!
:p
Chief amongst these is that I admit I know next to nothing about the forex and have never traded it. So, you can use me as a guinea pig. My interest in forex (and this thread) is that I'm sure if I can develop a better macro view of the market as a whole, it will inform my decisions about the one I like and trade: U.S. equity indices, primarily the Dow..... its a very fair and valid question - but after thousands of posts and many years talking to newbies and traders alike the basic fundamentals are not really in place for most to start thinking intermarket analysis.........so I wont be covering it ......this is intended to be Strengthmeters 101 for beginners ;)


So, first forex newbie question from me: what is a 'forex strengthmeter' - how are you defining it and how does it help your trading?
Tim.
- good question....we start soon :smart:
 
This Thread will not cover intermarket correaltion .......thats a huge subject
Hi Neil,
Understood - and that's fine. I wasn't expecting you to cover it as such. What I meant to say - and expressed myself poorly - is that if this thread helps me to understand the relationship between different currencies, then this may be useful in my trading of the Dow. It's down to me to decide what the inter-market correlation is, but understanding what's going on internally within the forex market seems like a good place to start. I think!
Tim.
 
Hey Tim

yes possibly..........in this modern day and age all markets seemed joined at the hip !

my other thread here for many years has always had this assumed "connection/correalation" between global equities (represented by the Dow) and the Yen and USD currencies ..........and I have always advised in my basic introductory system to trade where one or both of these guys are moving inversely to the Dow....

I have to say in all honesty that I dont use this intermarket directional rule much in my own proprietry systems these days....thats not to say its not a perfectly robust approach ......... I just personally dont use it

sufficient to say that I am more interested these days in the levels of volatility and momentum in global markets (and that relationship to currency dynamics) than any prescribed directional biases .........as increased noise in the markets will generally get the forex markets humming ......(but remember its not the only thing that moves forex around)

ok gang ......I will have my first posts up by the weekend ....and I repeat again it will be aimed more at newbies as these seem to be the guys I have been responding to the most over the years with my Strengthmeter work...........:smart:

N
 
Last edited:
ok lets start .............remember its pretty basic and the building blocks will grow ....
 
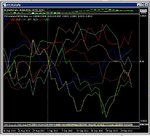
so whats a FOREX STRENGTHMETER ?

well its a strengthmeter that is exclusively showing FOREX related instruments (and derivatives) on it .......thats it ! (not Crude oil , not equities or bond prices ....just forex......)

A Forex Strength Meter is a tool that measures the relative strength of a few or several forex instruments on one chart . the Currency instrument strengths are measured using the feeds from real-time data using the currency pairs involved. the method of comparison is usually MA based (although not exclusively) and that is where this thread will focus ...MA based tools

and You will need to make 2 important choices on the chart

1) what instrument(s) do you want to include/exclude & compare ?
2) what MA setting do you want to use to compare them ?


example below
N
 

Attachments

  • forex strengthmeter.JPG
    forex strengthmeter.JPG
    89.3 KB · Views: 1,675
Last edited:
heres the indicator to support the example above .........its based on the 8 main currencies and is what I created and adapted from more historical (free) versions available on the web in about 2002 (I think !)

BUT I AM JUMPING AHEAD OF MYSELF .........we have much more to discuss before I let you loose on this kind of stuff .......

N
 

Attachments

  • FXCORRELATOR_BASIC_FREE_VERSION_2013.mq4
    6.7 KB · Views: 1,116
Last edited:
one thing to remember (as I know you are going to load it !!!) .....you may have a platform that adds certain (syntax) lettering alongside the pairchart names (eg EURUSDbxx)......you will need to put any additional coding into this area on the indicator settings or it wont work

if no syntax then leave it blank...

N
 

Attachments

  • settings.JPG
    settings.JPG
    47.3 KB · Views: 985
remember to ask questions as we go along............this is for beginners as well as anyone else interested .......

N
 
remember to ask questions as we go along............this is for beginners as well as anyone else interested .......
Hi Neil,
Excellent start - looking forward to seeing how this develops.
(y)

Whilst I'm not a newbie trader, as I've made clear already, I know precious little about Forex. I know even less about coding and software stuff. So, I won't load the indicator you posted, not least because I don't know how - or if it's possible even using the software I use.

The point of mentioning this is that if you want to keep technophobes like me engaged, you'll need to bear in mind that some subscribers to the thread are very interested in learning the principles involved, but aren't necessarily interested in the techie side of things. It would be great if you could keep the two separate, as I'll quickly glaze over and lose interest if you start talking about syntax, file extensions and coding etc.
Thanks,
Tim.

understood ..............and if you knew me like the many programmers i have been lucky enough to work with over the years you will KNOW I will only be talking the basics regarding thhe tech side .........enough to get the indicator up and running and how to change the ma setting :smart:

to describe me as a Techie will make them all laugh.....I am an absolute programming clod ...hahahaha.........ask Jedster :LOL:

N
 
Hi all

Ok heres the next instalment regarding Strengthmeters……

As I mentioned most Forex Strengthmeters are MA (moving average) based …and my FXCorrelator is MA based as well ……

Moving averages are almost like the building blocks of indicators… MA's (and their derivatives) sit inside over 90% of all indicators in the market place……(but don’t quote me !).

So lets see now how this works and I will next explain what all those pesky lines are actually doing on a Strengthmeter chart ………

N
 
This is a humble EURUSD candlestick chart……..it has a 20 MA (moving average) line on it (in yellow)

the moving average line looks at the last 20 bars closing prices and works out the average of them .......and then shows it as a yellow price line that runs like a “backbone” through the candlesticks on the chart

(I am not going into great depth here on MA’s and the variations ….look them up …….theres thousands of posts dedicated to using MA’s ……:eek:…)

Ok so far ?

N
 

Attachments

  • 20 ma.JPG
    20 ma.JPG
    45.2 KB · Views: 847
Ok heres the clever bit ……

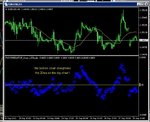
I am now going to show you a Strengthmeter style indicator for the EURUSD underneath the Chart we just looked at …………

The blue x’s you see on the lower chart/Indicator represent the closing prices on the top charts Candlesticks ………..and the Yellow line on the bottom chart represents the same values as the Yellow line on the Top chart

Except you can see that the Yellow line on the bottom Indicator has been Stretched out straight and placed at a value of Zero along the chart

OK ?...........so the bottom chart has simply straightened the Yellow line …..all else is the same as the top chart

N
 

Attachments

  • the strengthmeter concept.JPG
    the strengthmeter concept.JPG
    75.8 KB · Views: 906
Last edited:
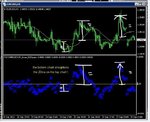
So just to reiterate this ………if you measure the distance between any X and the Yellow Zero line on the bottom indicator it will be equal to measuring the distance between the 20ma yellow line and the closing candlestick on the top chart

They are always the same value ………what we have done on the lower indicator is made this value more easier to read ………and created a ZERO baseline for the 20 ma line
 

Attachments

  • same distances top and bottom charts.JPG
    same distances top and bottom charts.JPG
    75.5 KB · Views: 1,076
Last edited:
NVP - watching your thread with great interest. I've been thinking the slope of the moving average informs the relative strength - but can see how the actual price relative that slope will give are far more definitive indication of current strength as well as being far more responsive. Extremely thought provoking.
 
Ok I know this all looks pretty simple …and its pretty easy to read on the top chart anyway ?? :cool:

But imagine if there were now up to 8 price lines on the top chart (EURUSD, GBPUSD,AUDUSD, etc,etc) and also 8 ma lines attached to them ……

would it be easy to read the MA variances then ? :eek:

N
 
NVP - watching your thread with great interest. I've been thinking the slope of the moving average informs the relative strength - but can see how the actual price relative that slope will give are far more definitive indication of current strength as well as being far more responsive. Extremely thought provoking.

yep ..............but beware slopes ...they must always ideally be quantified and not used by simple eyeballing.....as MT4 indicators are always good at re-sizing and can be deceptive and misleading :smart:

N
 
Top