Forex Profit Monster - 4H TF

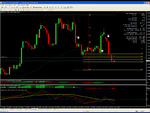
Success - the 8H are "live"!

Hmmm.

I have kept the 1H naked charts open, but the data is not updating into the 8H offline charts.

I may have to go back and repeat the exercise, to ensure I have not missed anything.

Will keep you posted.

Cheers

Ivan

OK - have it working well now - thanks for your patience.

Will trial these 8H charts to see if there is an advantage over 4H ... watch this space.

I am already thinking that there will be a benefit to people who wish to follow the 4H but do not have the time. And when the Daily does not offer enough opportunities to enter a trend, then these 8H charts will act as a kind of compromise.

As I write, the EURJPY has run against us. It is now 114 pips in the red. I decided to give it more room, and extended the SL to 135.89 - 231 pips away. I think that is a fair placement.

But we have to keep in mind this is a ***JPY pair, and the volatility can be huge. Current Daily ATR is 143 and 4H ATR is 53 pips. The trend seems to be topping as I write, so hopefully this is the reversal we need to get this trade into profit.

I think I am much wiser after watching this trade this morning, and I believe I will be a bit more selective in the pairs I trade. I will probably avoid any pair that is currently stuck in a range - particularly the ***JPY pairs. We'll see. It is hard enough battling the uncertainties of the market, without getting into trades that are range-bound, and volatile to boot!

And I may boycott any trade that is clearly NOT running with the longer trend. It is well-known that all large trends take their feed from smaller trends, not the other way around. But having said that, I believe if there is a dominant trend, then "usually" the lower TF trend will conform to this.

However, there is one case where this is definitely NOT true - and that is when there is a reversal of trend. Under that scenario, the "dominant trend" becomes eroded away by the lower TF as they creep closer and closer.

1 Min is where it starts (well tick-by-tick really) and then 5 Min, 15 Min, 30 Min, 1H, 4H, Daily, Weekly.

So there is a dichotomy -
On one hand we have the Dominant Daily or Weekly trend, supported by the lower TF even through their noisy waves
On the other hand, we have the "noisy waves" with a mind of their own, gradually eroding the power of the Dominant trend, until the trend bends and reverses at some point.

I think there is a lot of skill involved in reading the action as it is occurring, and I find the Pin Bar candles very helpful in this respect. But the whole purpose of having a method is to circumvent the need to be making these judgements, I believe.

If the signal is given, then why not just take it?

I think all of us need to be making our own rules and refinements, and I hope that what I post is seen as an attempt to explain what I am seeing, feeling and finding, so that when YOU, dear reader, come to enter your OWN live trades, you are already prepared for what may await you.

I hope this is not too boring to anyone - but essentially this stuff has to be understood at some point, without making it an unnecessary complication of the FPM method.

Best wishes

Ivan
 

Attachments

  • eurjpy_4h_2.gif
    eurjpy_4h_2.gif
    25.5 KB · Views: 433
Wash-up

Scanning through the other 7 pairs just now, I notice that:

USDCAD 4H has its SLOW Trend about to cross above the zero line, which will trigger a LONG entry. But we still have a couple of hours to go for that 4H candle to complete, so be patient.

USDJPY 4H triggered an entry SHORT @ 90.116 and is currently 26 pips in profit. It is possible to grab an entry on this one if you think it has legs.

USDCHF 4H triggered a SHORT entry @ 1.01643 and is currently 5 pips in profit. I am already in this trade, but it is range-bound.

EURUSD triggered an entry LONG @ 1.48420 and is currently about 40 pips in profit.

GBPJPY triggered a LONG entry @ 150.149 and is currently also about 40 pips in profit.

GBPUSD triggered a LONG entry @ 1.65220 and is currently also about 140 pips in profit.

AUDUSD triggered a LONG entry at .91008 and is currently also about 135 pips in profit.

Those are the trades the FPM is in right now, so we just have to be patient. Opportunity is still there to enter some that have not moved much yet, but I would allow them to pass - there may be good reason why these didn't move into profit quickly.

Best wishes

Ivan

Here in Oz it's about 9pm AEST which means it's about 11am GMT.

The London open has come and gone, and so let's see where our prospects are at this time.

USDCAD: Well the SLOW trend did cross the zero, just long enough to put us on notice to enter the trade LONG at the opening of the NEXT candle. But the price reversed so convincingly, that I doubt anyone would have gone LONG against that action. We now have a SHORT arrow, and the SLOW trend is under the zero. We are waiting for the FAST Trend to dip under the line to trigger the SHORT trade. What a typical Monday event!

USDJPY: WE should be SHORT from 90.116, and thus in profit by about 24 pips as of now.

USDCHF: We should be SHORT from 1.0164, and in profit by about 91 pips atm. I was already in this trade, and was sick or the range-bound action. As soon as I had my small profit, I closed it and moved on. Too bad that it made another 50+ pips afterwards!

EURUSD: We should be LONG from 1.48420, and in profit by 155 pips atm.

GBPJPY: We should be LONG from 150.149 and in profit by 175 pips at the moment.

GBPUSD: We should be LONG from 1.65220 and in profit by about 300 pips right now.

AUDUSD: WE should be LONG from .91008 and in profit by about 185 pips atm.

And of course our star of the day ... not ... EURJPY!!!

I entered one mini lot SHORT at 133.578 at the early turning point on the 30 min chart. As I write, the price is 134.822 - a loss of 124.4 pips. It seems to be topping, but I am not too sure the TA supports a top just yet.

Now I am aware we couldn't get into some of those other 7 pairs, but I put this info on the thread so that we can get a bit of motivation, and see the potential of the method.

Another thing I can not be responsible for, and that is when folks just drop in, grab the readings, and drop out.

This is very foolhardy, and irresponsible.

If you want to trade the Forex Profit Monster, for goodness sakes just spend 50 bucks and get the thing for yourself. Then come onto the thread and ask a few questions, trade it in demo, and fine tune your skills. I seriously doubt anyone could seriously profit through looking at someone else's calls, without having the ghost of an idea why they were validated, if at all, and hope to manage the trade without a clue about when and why to close out!

I hope that doesn't apply to any silent readers - because that is a disaster waiting to befall you. I can not make this any more open that it already is, so please, feel free to ask a question or two - I am house trained, and muzzled!

Anyway - I proved today that I am not fit to be let loose with an account! I had the USDCHF open already, then opened the EURJPY. While setting up the charts side-by-side, I noticed these two pairs have a very high degree of negative correlation. being SHORT both pairs is insane, which I soon found out when looking at my a/c balance.

As soon as I had a profit from my USDCHF, I closed it. But guess what - because of the neg correlation, of course the EUJPY was well into loss by then. However, I persisted because it is a system entry. I feel like an utter dill! All it has netted me is a large drawdown and a ton of experience!

I could have traded differently, but was keen to show how to trade the FPM - which I should say I did - even though in loss so far.

I have never been afraid to post my trades as they happen (see: http://www.trade2win.com/boards/for...-life-position-trading-higher-time-frame.html) - warts and all.

Anyway - hopefully we get this stuff out of our gut early, and become better managers. I can see by the current open trades, that FPM should do well this month.

Best wishes

Ivan
 
OK - have it working well now - thanks for your patience.

Will trial these 8H charts to see if there is an advantage over 4H ... watch this space.

I am already thinking that there will be a benefit to people who wish to follow the 4H but do not have the time. And when the Daily does not offer enough opportunities to enter a trend, then these 8H charts will act as a kind of compromise.

As I write, the EURJPY has run against us. It is now 114 pips in the red. I decided to give it more room, and extended the SL to 135.89 - 231 pips away. I think that is a fair placement.

But we have to keep in mind this is a ***JPY pair, and the volatility can be huge. Current Daily ATR is 143 and 4H ATR is 53 pips. The trend seems to be topping as I write, so hopefully this is the reversal we need to get this trade into profit.

I think I am much wiser after watching this trade this morning, and I believe I will be a bit more selective in the pairs I trade. I will probably avoid any pair that is currently stuck in a range - particularly the ***JPY pairs. We'll see. It is hard enough battling the uncertainties of the market, without getting into trades that are range-bound, and volatile to boot!

And I may boycott any trade that is clearly NOT running with the longer trend. It is well-known that all large trends take their feed from smaller trends, not the other way around. But having said that, I believe if there is a dominant trend, then "usually" the lower TF trend will conform to this.

However, there is one case where this is definitely NOT true - and that is when there is a reversal of trend. Under that scenario, the "dominant trend" becomes eroded away by the lower TF as they creep closer and closer.

1 Min is where it starts (well tick-by-tick really) and then 5 Min, 15 Min, 30 Min, 1H, 4H, Daily, Weekly.

So there is a dichotomy -
On one hand we have the Dominant Daily or Weekly trend, supported by the lower TF even through their noisy waves
On the other hand, we have the "noisy waves" with a mind of their own, gradually eroding the power of the Dominant trend, until the trend bends and reverses at some point.

I think there is a lot of skill involved in reading the action as it is occurring, and I find the Pin Bar candles very helpful in this respect. But the whole purpose of having a method is to circumvent the need to be making these judgements, I believe.

If the signal is given, then why not just take it?

I think all of us need to be making our own rules and refinements, and I hope that what I post is seen as an attempt to explain what I am seeing, feeling and finding, so that when YOU, dear reader, come to enter your OWN live trades, you are already prepared for what may await you.

I hope this is not too boring to anyone - but essentially this stuff has to be understood at some point, without making it an unnecessary complication of the FPM method.

Best wishes

Ivan

~You're welcome.... well the advantages are of course our time constraints... being able to trade it consistently and at same time giving a bit more opportunities than the Dailies.

The only disadvantage is well, less opportunities I guess, instead of around 400 trades per year, maybe with this timeframe a person would expect probably half? around 20 trades per year per pair?
 
It's def one of those days - I got stopped out on the EUR/JPY but my fault as I couldn't get to check the charts - if I did I would've done the same as you Ivan and move the S/L. Was already stopped out withe USD Right now I'm showing a small profit of 18pips on the USD/CAD - took a short position at around 1400GMT and a small loss on the EUR/USD (which was showing a profit on my long position but has reversed somewhat.

Two conclusions to draw like you - the correlation... pay attention.
The ranging pairs (even though there's a signal)

But you can't win really, because it could be ranging (like is the EUR/JPY at the moment), one says 'I'll wait" then there's the breakout (going the right way of course)
the crystal ball indicator is (rumour has it) the best! :LOL:

On the D1 I'm hoping the EUR/USD may reach it's previous high of 1.50579 and I've set my T/P just a few pips below that. We'll see.

Right now I think it's a good idea to avoid the USD/CHF, USD/JPY and EUR/JPY
And could be the USD/CAD trade is running out of steam - the TDI I've posted shows the red dipping below the 50 line and the blue bands somewhat compressing showing a decrease in momentum. Of course the time of night could be responsible so we'll see...
good trading all :)
 

Attachments

  • Picture 1(2).png
    Picture 1(2).png
    119.2 KB · Views: 697
Other useful things ...

It's def one of those days - I got stopped out on the EUR/JPY but my fault as I couldn't get to check the charts - if I did I would've done the same as you Ivan and move the S/L. Was already stopped out withe USD Right now I'm showing a small profit of 18pips on the USD/CAD - took a short position at around 1400GMT and a small loss on the EUR/USD (which was showing a profit on my long position but has reversed somewhat.

Two conclusions to draw like you - the correlation... pay attention.
The ranging pairs (even though there's a signal)

But you can't win really, because it could be ranging (like is the EUR/JPY at the moment), one says 'I'll wait" then there's the breakout (going the right way of course)
the crystal ball indicator is (rumour has it) the best! :LOL:

On the D1 I'm hoping the EUR/USD may reach it's previous high of 1.50579 and I've set my T/P just a few pips below that. We'll see.

Right now I think it's a good idea to avoid the USD/CHF, USD/JPY and EUR/JPY
And could be the USD/CAD trade is running out of steam - the TDI I've posted shows the red dipping below the 50 line and the blue bands somewhat compressing showing a decrease in momentum. Of course the time of night could be responsible so we'll see...
good trading all :)

Well we probably picked a difficult time to get into a trade. I closed mine about 3 hrs ago for 112 pips loss. I did that because I could see the EURJPY beginning to bounce off support one more time. In fact, the price was bouncing when I went SHORT ... totally against the trend.

It might be simple to follow, but it's not easy.

It's quite OK to take the trades that FPM throws up, of course, but it is NOT OK to do so without checking all of the other things you might check prior to opening a position.

Chief amongst these would be Support and Resistance. Why take a short position when the price is obviously moving in a rally bounce, after respecting support? Essentially that is what I did, even though the FPM called for the entry at the open of that candle. How did I miss that? Must be the exhuberance of my youth!

All the "open" of a candle does, is tell us whether this is the time to look for the entry - not to just grab the entry at any price. The trigger that the trade is "on".

Part of trading this monster, is being prepared to miss pips at entry, simply to ensure you are not entering at the wrong time. If we jump straight in without having a look around at higher and lower TF, then we are increasing risk in an unnecessary manner.

It is not acceptable to rely on good luck to get the entry right. I say we have to work just as hard at that as with any other system. All we have here is another edge to use as a tool, and as such, tools have specific purposes.

Looking over the TA of it EURJPY has been in an uptrend on the 4H chart since 2nd November 2009. Price has just respected Fibs resistance at 134.75 and is heading down to support at the 50% level, 134.44. I am expecting price to bounce around here, and head higher again, but so far I have been a poor race caller!

No time left - might get to post the state of the 8 pairs later on ... but I am certain others can do that just as easily as I

Feel free - if you are enjoying the thread, just jump in with your views - we are all learning here, and it looks like it is a bit of a struggle right now.

Best wishes

Ivan
 
ivan, are you using mtf stoch?

My apologies Dave - I saw your question earlier and it slipped my mind to respond.

The short answer is: "Not here" because I am trying to see if we can get FPM working as a "pure" stand-alone method.

But in other applications, I do use it as a part of my template.

Below is a chart of the EURUSD 4H using the MTF Stochastic.
Compare that to the EURJPY_4H also shown.

This tool may have kept us out of poor trading opportunities.
 

Attachments

  • eurusd_1.gif
    eurusd_1.gif
    52.6 KB · Views: 454
  • eurjpy_1.gif
    eurjpy_1.gif
    61.6 KB · Views: 1,162
stick to the rules. i bailed on the usdjpy cause stoch turning down but it bounced up off trendline. still in usdcad short and usdjpy sh
 
USD/CAD is showing a nice move - I'm about 80+ pips in profit at the moment (got in slightly late). The question is - when to get out? Speculating here but after the current mini-stall it may well reach an old support level at 1.04176 :sneaky:
 
Made a nice profit on the EUR/USD but leaving things alone for the moment due to weirdness in the market, no noticeable trend. Waiting is part of trading I guess! A good weekend to all :)
 
I decided to upon a small account in order to test this one... 2K to be more exact. let's see what this is worth... i probably will trade the 8 or 12H charts so I don't get too much on my hands and that this "experiment" doesn't get too much in the way of my normal trading... Since it will be a slow trading I will try to post monthly or bi-monthly results
 
Sorry I have been unable to continue the updates.

Work is th' curse of th' tradin' man!

Will have to let this thread go a bit, but will try to update from time to time.

Meanwhile anyone who is trading FPM, it would be appreciated if you could post a trade or two any time you notice a setup. Thanks Sal, Dave, Forexsniper and CP1 for your interest. I hope we have shown how the system works in one sense, but haven't actually been able to pick a setup from scratch and actually trade it through to a happy ending.

Would like to do that exercise yet. Funny how involvement in the longer TF was meant to free mus from screen-watching ... it may have done that, but it got us into more bondage - the check-me-at-the-close-of-every-4-H-candle enslavement.

It's not as bad as the screen-watching enslavement, but it still does not free us from intra-day candle seeking!

Cheers all - will check back in when time permits.

Best wishes

Ivan
 
I have a very interrupted schedule for ANYTHING at the moment - I've missed a few 4H charts and would dearly love to stick to just D1 - unfortunately stop losses are way too high for that and I'm trying to train my eye on the 4H...
The way things are with some of my favourite pairs it's just as well I suppose! ;)
 
i let this product go dormant. i could not keep up the 4hr trades like i should. and daily i let it run for two weeks without a signal. i really like it and im thinking i may request a coded version for my newer demo account and give it a go again. it made good pips. it was hard for me to set it aside when it had made great pips. work is somewhat easy to deal with the harder issue and im guessing some on here could tell me better im in the usa so while im sleeping the european session is going on and im sure alot of the 4hr signals come during this session.

anyone have any suggestiong on how to get the 4hr signals to work and get some sleep in the usa. or any feedback on the daily signals.

thanks
mike
 
Long GBP/USD - a bit later at 1.67260, short USD/CHF 1.00805- also a bit late. On the latter I'm in two minds where to put the TP as there are 2 intermittent support lines before it hits the FPM support - one at 1.00679 and one at 1.00625 (approximetely). Possible EUR/USD coming up?
 
i let this product go dormant. i could not keep up the 4hr trades like i should. and daily i let it run for two weeks without a signal. i really like it and im thinking i may request a coded version for my newer demo account and give it a go again. it made good pips. it was hard for me to set it aside when it had made great pips. work is somewhat easy to deal with the harder issue and im guessing some on here could tell me better im in the usa so while im sleeping the european session is going on and im sure alot of the 4hr signals come during this session.

anyone have any suggestiong on how to get the 4hr signals to work and get some sleep in the usa. or any feedback on the daily signals.

thanks
mike


go for 8H or 12H that's what i'm doing... 4H is too much for me too... but Daily charts is too slow as well, so I went for 8H which serves me well... at 7AM, 3PM and 11PM
 
that would work pretty much perfect salvador. how do i get an 8hr timeframe though. my metatrader only has 4hr and daily. i read somewhere of a way to do it offline i will try to find that. if you could direct me in the right direction that would be great.

thanks
 
Top