Forex basics and my trading with FBS

What happened?

Brent returned to the rising channel on Wednesday by gaining 4% during the trading session. Investors are still looking towards risk assets despite data showing an unexpected rise in US oil inventories.

The fall was caused by the deal between members of the Organization of Petroleum Exporting Countries and allies, known as OPEC. The organization decided to raise supply by 400,000 barrels a day from August to December 2021. Investors were also scared about the new COVID Delta strain.

Oil price keeps growing, despite the fact that the US crude stockpiles went up for the first time since May. Investors are positive about the future as they are sure that the demand will exceed supply during 2021.

At the moment, the price is trying to break $73.3 resistance. It is an intersection of 100 and 200 period moving averages, also it is 23.6 Fibonacci level. On the RSI oscillator, the downtrend has been broken, which means bulls still have enough power to push Brent higher.

In the short term: If the price breaks $73.3 resistance, it will shortly reach the 74-74.5$ range. Otherwise, it might test the 50-period moving average at the level of 72.3 before the upcoming raise.

In the long-term: As the price breaks the $73.3 resistance level, it will head towards the top line of the rising channel with a target range between $77.3-$77.7.

XBRUSDH4.png


Reference: FBS (23.07.2021) Brent: future is stil sunny. FBS analytic news.
 

What will happen?

FOMC statement will be announced at 21:00 MT (GMT+3) on Wednesday, July 27. In the previous article, we have already mentioned the importance of this event. Analysts and traders will closely follow this meeting since the Federal Reserve statement about interest rates might make a huge effect on markets.

The must-watch comment is the one on tapering. This is what will determine whether gold rallies or sells off after the Fed meeting. And with growing concerns that the US economy will slow in the second half of the year, tapering might no longer be as urgent as it seemed just a few weeks ago.

If the Federal Reserve gives any kind of signals about stimulus tapering, it will put a negative effect on gold. On the contrary, if there are no sings of tapering, gold will get a boost.

Technical analyses

The price is consolidating under the 200-period moving average. RSI oscillator got close to the buying zone. MACD shows that the bearish trend got weaker since June.

Dovish FOMC statement could help gold to break the 200-period moving average, which is highly important resistance. After the break, the price will have lots of space above. Targets will be $1830 and $1877, which are 38.2 and 50.0 Fibonacci levels respectively.

On the flip side, if FOMC gives signals about stimulus tapering, the price will drop and test 23.6 and 0.0 Fibonacci levels, which are $1772 and $1680 respectively.
XAUUSDDaily.png


Reference: FBS (27.07.2021) Gold: FOMC meeting will clarify the future. Fbs analytic news.
 
USD/JPY declined further during yesterday’s trading, reaching as low as 109.36, while our short signal from 110.20 is still active and is giving us over 80 pips. Technical indicators are still suggesting further declines ahead. However, another dead cat bounce could be seen at the final session of the week, which is also the last session in July. Therefore, it is wise to take our profit and/or close some of the positions and move the Stop Loss lower by 35 pips, this is only if you decide to hold the trade until next week. Otherwise, +80 pips on one single trade aren’t bad. I’m trying not to be greedy.

usdjpy2.png


Reference: FBS (30.07.2021) USD/JPY Take your profits. FBS analytoc news.
 
The Reserve Bank of Australia decided to keep the current policy unchanged as widely expected. However, and against all odds, the bank took the first steps toward winding back emergency monetary stimulus for an economy that’s exceeded forecasts. The BRA made this move even though many saw the bank hinting for a possible increase in asset purchases amid partial lockdown in parts of the county due to the high rate of covid19 cases. Yet, the plan to taper by 1B in September could be a message that the RBA is seeing some inflation pressure on the horizon. In the meantime, AUD/USD is still in a retracement mode, which may target 0.7470 and 0.7530’s before the downside trend resumes. Therefore, I would long some AUD/USD around here 0.7380’s with a stop at today’s low only.

AUDUSDDaily 03 Aug 2021.png


Reference: FBS (03.08.2021) RBA sticks to tapering plan. FBS analytic news.
 
GBP/USD is currently trading within a new selling zone on both short and medium-term charts. The zone stands between 1.3915 and 1.3990 which represents its 50% and 61.8% of the recent selloff from June 1st top to July 20th bottom. This area remains solid since last week, while we wait for the Bank of England's decision later today. Yet, it would still be worth it to risk a short position with a stop above 1.4020, especially after the pair failed to break above its 100 and 50-day MA’s yesterday, while the technical indicators remain around the 50 mid-point (RSI). On the downside view, the first initial target would be 1.38 which could be seen later today, especially if the BoE decides to avoid tapering discussions.

GBPUSDDaily 5 Aug 2021.png


Reference: FBS (05.08.2021) GBP/USD Selling Zone! FBS analytic zone.
 

What is happening?​

The Senate of the US has voted for an amendment to President Biden’s infrastructure bill. The Senate allows for 30 hours of debate following a vote. This means that the amendment can be debated up until Tuesday morning, after which it would be signed into law.

Senate deliberations continued over the weekend over a $1 trillion infrastructure bill, with a particular focus on how the bill could impact the world of cryptocurrency. The bill includes a tax provision that outlines plans to raise about $28 billion for that $1 trillion package through taxes from crypto transactions. The bill identifies a “broker” as anyone “responsible for and regularly providing any service effectuating transfers of digital assets on behalf of another person,” and anyone thus identified would be subject to tax reporting requirements.

Cryptocurrency investors are unhappy with the new tax provision. Not only it defines miners and cryptocurrency wallet makers as brokers, but it also obliges companies to report information about individuals even if they are not customers. Passing the bill will have a bloody impact on the cryptocurrency market, as well as on all companies somehow connected to it.

More on Coinbase​

Coinbase now supports Apple Pay when buying cryptocurrency, meaning that users can buy with debit cards that are linked to Apple's system. Coinbase is the first crypto exchange to offer instant transactions via Real-Time Payments (RTP), enabling customers in the U.S. with linked bank accounts to instantly and securely cash out up to $100,000 per transaction.

It is important to notice that Coinbase makes the most of its profit in the most volatile markets, due to increased trading volumes and therefore increased amount of fees collected. Nevertheless, Coinbase stock correlation with Bitcoin price is hard to underestimate. Such an effect is caused by the nature of Coinbase as a cryptocurrency exchange and the majority opinion that everything somehow linked to crypto needs to correlate with Bitcoin price movements.

Technical analysis​

Right now, Coinbase is breaking through resistance lines, after forming a “triple bottom” reversal pattern. RSI is also looking quite bullish. If the news about the infrastructure bill won’t crash the price, the next resistance line will be at $300, a round number, and a Fibonacci expansion 161.8 line. Otherwise, there is a big support area between $250 and $235.Bitcoin is moving in a channel, that has been already broken once. RSI has formed a bearish divergence, so it’s dangerous to open a long position now. In case of a price falling, the main support area is $40000-$39000.

BTC+COIN3.png


Reference: FBS (09.08.2021) How does new infraestructure bill affect coinbase? FBS analytic news.
 

Current news:​

  1. Reserve Bank of New Zealand will likely deliver up to two interest rate hikes before the end of the year.
  2. Risk-off flows strengthening in the NZD/USD pair.
  3. Chinese economic outlook downgrade, inflation causing concern.
The risk-sensitive New Zealand Dollar weakened overnight as global concerns over the highly transmissible Delta Covid variant weighed on sentiment. The US Dollar is also weighing on NZD as rate hike bets rise following last week’s NFP report. Moreover, Goldman Sachs downgraded its growth forecast for China. Analysts at the bank see Covid-induced lockdowns and social distancing measures dragging on spending and consumption.

Why is it important?​

Foreign exchange markets are presently focused on central bank interest rate normalization, favoring the currencies belonging to those central banks which will lead the pack. July 14, 2021, RBNZ (Reserve Bank of New Zealand) said it will reduce monetary stimulus by ceasing quantitative easing. It was the first sign of a future interest-rate increase. Shortly after, New Zealand’s unemployment rate was released, with actual results being less-than-expected by as much as 0.4% (4% vs. 4.4%, this is a good sign to an overall economic situation).

The labor market report is the latest sign that the economy is growing faster than its capacity, and that the Reserve Bank could start to raise the official cash rate to keep a lid on price pressures. Annual inflation surged to 3.3% in the second quarter, breaching the central bank’s 1-3% target range.

If RBNZ continues normalizing interest rates by raising them, we would expect strong fundamental support for the New Zealand Dollar. August 18, RBNZ will release several essential market reports. Among them are the Official Cash Rate, RBNZ Monetary Policy Statement, and Rate Statement. Considering the facts given, we’re expecting rate hikes as well as NZD strengthening against other currencies.

However, while the Chinese economy is vital to global growth and capital markets, New Zealand is particularly susceptible due to its economic and trade proximity. Covid related risks are also present, although the market participants ignored Delta's initial spread. Make sure to check our Economic Calendar regularly!

Technical analysis:​

Looking at the NZD/USD live chart we can see a support line at 0.690 and we have a resistance between 0.705 and 0.710, where the “death cross” bearish pattern has emerged.Considering the newfound pessimism for the economic outlook in China, the New Zealand Dollar may remain capped near current levels. Still, NZD bulls may be able to take advantage of the situation. The Australian Dollar typically displays a higher correlation with China’s economy, which can open the door for AUD/NZD to underperform.Currently, AUD/NZD pair has a support line at 1.04594 and resistance at 1.10595, right at 38.2 Fibonacci retracement level.

NZDUSDDaily.png


Reference: FBS (10.08.2021) NZD is expiriencing challenges with forecast. FBS analytic news.
 
EURUSD declined slightly at the beginning of yesterday’s trading, reaching as low as 1.1705 right before the US data. The pair then bounced off that support all the way to 1.1750’s, leading our long position to be in profit once again. In the meantime, we maintain the stop at 1.1690 ahead of today’s session. The current signal comes as a short-term play after the Euro declined for 8 straight sessions. At the same time, if the pair managed to break above 1.1750 today, I would move my stop to the entry in order to protect the position from any possible loss.

EURUSDDaily 12 Aug 2021.png


Reference: FBS (12.08.2021) EURUSD Trade update. FBS analytic news.
 
The US Dollar soared higher since the beginning of the Asian session until this report is released. Such rally comes as a reason of the Asian and the European markets to the Federal Reserve meeting minutes, which showed that the Fed is somehow preparing the markets for QE tapering before the end of this year, which could actually happen in December's meeting.

However, the Fed also stressed that they are still watching Covid19-Delta developments in the US, as infection rate is still increasing, and if things for even worse, the fed might delay such decision. Yet, the market is not concerned about delta yet, they are now concerned about lower liquidity by the Fed and other central banks, and therefore we are seeing a broad selloff across the board.

In the meantime, I would stand aside and watch how the US market will react today, as the current move might be a bit excessive, as the info that we got from the meeting minutes is not something new. But such move, could be a new opportunity for those who likes swing trades.

As for today, I will be watching 93.50 resistance area as it won't be easy to be broken. Another downside retracement is highly possible, which may retest the 93.0 support area, before the upside trend resumes.

UsDollarDaily.png


Reference: FBS (19.08.2021) USD Skyrocketing. FBS analytic news.
 
Throughout last week’s trading, gold traded within a tight range, but it also managed to hold well above its 1775 support area until the end of the week, while the technical indicators has improved over the past few days, including the RSI indicator, which is now trading above the 50 mid-point and broke its daily down trendline, which support our medium-term long positions, the one issued few weeks ago at 1730. With that being said, it would be wise to move our stop loss for this week to 1765 USD/Oz to protect some of the profit, while further stabilization above 1775 may clear the way for another test of 1800 USD/Oz in the coming days.

XAUUSDDaily.png


Reference: FBS (23.08.2021) Gold holding well above 1775. FBS analytic news.
 
The US Dollar Index failed to sustain its recent gains above its 50 DAY MA, the index declined back yesterday with higher trading volume, while all eyes are on the PPI data today after mixed economic releases over the past few days and last week's jobs report. In the meantime, the technical indicators are still suggesting further declines ahead, with a possibility to retest last week's lows round 91.80, while any short position should be attached with a stop loss not to exceed this week's high.

2.png


Reference: FBS (10.09.2021) USD downside retracement resumes. FBS analytic news.
 
Usually, the gold price is driven by political and economic uncertainty, like economic crises, election pressure, pandemic effects. But in the face of a year-and-a-half-lasting monetary stimulus program, the price of the haven asset acts differently. What drives gold price and how to trade it – in this article.

Latest news:​

  • Gold breaks beneath $1800 with $1700 as a reachable target.
  • US 10-year Treasury yields rise, emphasizing the demand for the US dollar.
  • Fed plans to start bond tapering this year.
  • US inflation rate has already hit 5.4% in June and July 2021.

Retrospective gold movement analysis​

Fundamental analysis of gold should start with an explanation of gold nature. In the past, there was the Gold Standard. It was a system under which nearly all countries fixed the value of their currencies in terms of a specified amount of gold or linked their currency to that of a country that did so. Also, the supply of gold hasn’t been increasing greatly with time. Thus, when the amount of money was increasing (inflation rises), to buy the same amount of gold we needed an increased amount of currency. Since the economic crises usually come with high inflation, gold has become the haven asset for every country.

But nothing lasts forever, and in August 1971, US President Nixon severed direct convertibility of US dollars into gold. From this very moment, gold has become a more independent asset, but the rules of the game didn’t change much. Demand for gold is still high due to several factors: gold is resistant to corrosion, easy to process, hard to imitate, and looks beautiful (the last factor is subjective).

From this point we have several considerations about gold price movements, let’s go through them:

  1. US treasury yield rises USD demand rises USD rises.
  2. When USD is rising, gold (XAU) is plunging (this has come from times of the Gold Standard and remained even after it).
  3. Gold supply isn’t increasing as fast as demand, thus, in the long-term gold will continue to rise.

What is affecting the price now?​

Let’s go through several economic events and check whether they are affecting XAU price or not:

  • March 31, 2021: US ADP NFP data is worse than expected (517K vs. 552K; positive for gold, negative for currency). Gold has been skyrocketing for the next 6 hours and has gained 2%.
  • June 16, 2021: Federal funds rate remained at the same level (0.25%), which is positive for the currency. Also, there were intentions for rate hikes in the future. Gold has plunged 3% in 3 hours.
  • August 6, 2021: positive US NFP data (943K actual vs. 870K expected). Gold has “flash crashed” by 6.2% in less than half a day.
  • August 12, 2021: US PPI is higher than expected, which is positive for currency and negative for gold. XAU has fallen by 0.5% and surged 0.75% later that day.
  • September 1, 2021: OPEC+ reconsider oil output increase by 400 000 barrels per day. Negative ADP NFP data (330K actual vs. 695K expected). Gold price has remained the same.
  • September 3, 2021: US NFP three times worse than expected (235K vs. 720K). XAU has risen 1.15% in the next 3 hours, but in the next 3 days, gold had fallen more than 2%.
To sum up, this data, even if the events and the results are the same (March 31 and September 1), gold can act in a completely different manner. Besides that, we can expect gold to rise when any data is bad for USD and vice versa. This can be proven by looking at XAU/USD and US dollar index charts, or by looking at correlation charts.

What to expect from gold?​

So far (September 13, 2021) the economic recovery is not as fast as everyone wants and while tapering has been postponed, again and again, the demand for the US dollar is present and gold is not in a good shape. You might think: “Wait, if the economy is in a bad shape, then it’s good for gold, isn’t it?” Yes, usually in times of uncertainty gold is showing better results than other assets, like stocks and currencies. But this doesn’t mean that gold doesn’t fall at all.

From the side of technical analysis, gold is looking bearish too.

XAU/USD weekly chart

Support: 1750.0; 1685.0

Resistance: 1840.0; 1900.0


Gold is a perfect instrument to keep your money safe because it tends to maintain its purchasing power and save you from the volatility of other assets, but as global markets tend to rise on a bigger time scale, gold won’t earn you a lot.

XAUUSDWeekly.png


Reference: FBS (13.09.2021) Gold is acting randomly? FBS Analytic news
 

About Conflux

Conflux is an open blockchain network with an economic incentive-based governance mechanism designed to reward community members who contribute to ensuring a safe, stable, and predictable environment for economic activity. Conflux is focused on developing decentralized applications (dApps), creating smart contracts, and making simple payments. In simple words, Conflux is an exact copy of all known Ethereum, but more scalable and flexible.

Conflux history

Conflux is headquartered in Beijing, China. The Financial office was registered in Singapore in 2018.

Developers raised initial funds by selling the part of 1 billion CFX tokens issued on the Ethereum blockchain. After the launch of the main Conflux network, the developers generated 5 billion CFX tokens (most of them are still frozen) and launched the mechanism of additional emission of CFX coins (internal tokens of the Conflux network) available to earn by miners and stakers.

CFX is the main fuel of the Conflux platform and is used as a tool to interact with solutions in the Conflux Network ecosystem. Major CFX holders include venture giants such as Sequoia China, Huobi Group, Shunwei, and Rong 360.

Token holders receive a reward for their storage depending on the staking time.

Conflux features

The Conflux network has many advantages.

  • The throughput is 4000 transactions per second (for comparison, Ethereum has 15).
  • Proof of work algorithm, which means the cryptocurrency is available for mining on video cards.
  • Unlike many other blockchains (for example, Bitcoin, Ethereum), in which blocks are generated sequentially, one after another, in the Conflux blockchain network, parallel construction of a blockchain and transactions is possible.
  • Ethereum virtual machine support, so smart contracts can be ported from Ethereum to Conflux Network.
  • Block generation time - 2 blocks per second (172, 800 blocks per day).
  • Annual inflation is at 8.83%.


Conclusion

The main goal of the Conflux blockchain network is the development of digital technologies. Creators used Bitcoin and Ethereum’s developments as well as other innovative technologies to create a high-quality cryptosystem.

Despite this, Conflux is a young project, comparing with such giants as Litecoin, Bitcoin, Ripple, and Ethereum, which already recommended themselves as a reliable cryptosystem. That’s why we suppose the risk of trading CFX remains on a high level and suggest trading more sustainable coins such as XRP, ETH, BTC, and LTC.

Reference: FBS (14.09.2021) Conflux: Ambitious chinise project. FBA Analytic news.
 
USD/ZAR is mainly driven by the US dollar, that’s why the US economic data is highly impactful. The US has published strong retail sales for August. It pleasantly surprised investors as they were concerned that consumers would limit their purchases amid the spread of the Delta virus strain. However, retail sales posted a gain!

In comparison, South Africa's July retail sales (the freshest data so far) revealed a significant -11.2% year-on-year, versus market expectations for -2.7%. Such a huge drop was caused by the jailing of former president Jacob Zuma, which lead to the escalation of civil unrest.

Technical outlook​

USD/ZAR has been rising at a quite fast pace for the last three days. It has even broken through all three moving averages: 50-, 100-, and 200-day. The growth has been too quick though, we might expect a retracement (correction) to the support level of 14.50. However, the rally may continue till the price reaches the highs of early August at 14.80. The breakout above this resistance level will lead the pair to the psychological mark of 15.00.

USDZARDaily.png


Reference: FBSN (16.09.2021) Greatest sale of South African Rand. FBS Analytic news.
 
GBP/USD is moving inside the ascending channel. Since it’s in the lower part of this channel, the pair should reverse up and continue moving in zig-zag.

Short term​

However, fundamental factors ruined that plans. The UK has published poor retail sales for August. Analysts forecasted the 0.5% growth, while the actual numbers showed a drop of 0.9%. Thus, the pair is moving back and forth near 1.3785 as technical and fundamental factors are opposite in the short term.

Long term​

On Wednesday, the report revealed that the UK inflation reached a 9 year high in August, so the Bank of England can start taking actions earlier than the markets expect. The bank may start discussing the tightening: hint at hiking rates or cutting bond buys. If it happens, the GBP will surge.

Tech outlook​

The long lower tails signal us that bears were trying to push the price lower, but by the end of the sessions more bulls appeared, and they pushed the price higher. In other words, lower prices were rejected, so the price moved up. That’s why the price is likely to go up in the next session as well.

Thus, we might assume if the pair manages to close above the 23.6% Fibonacci retracement level of 1.3810, it may jump to the next round number of 1.3825 near the 38.2% Fibo level. Support levels are the recent lows of 1.3780 and 1.3750.

GBPUSDH4.png


Reference: FBS (17.09.2021) GBP/USD Is ready for reverse up. FBS analytic news.
 

What happened?​

It’s unbelievable but China’s government prohibited all transactions with cryptocurrencies (yes, even Bitcoin) and promised to stop illegal crypto mining. While the rest of the world is taking steps to include crypto into the economy, China denies it.

What does China mean for crypto?​

China is home to a huge part of the world’s crypto miners. As we know, mining requires a lot of energy resources and it prevents China from curbing greenhouse-gas emissions. Bloomberg says 46% of the global hash rate (computing power used in mining) occurred in China in April.

What will be the circumstances?​

It is a negative factor for the whole crypto market in the short term. Today, BTC/USD has dropped by 3168 points in one day. The downtrend is likely to stay with us for longer. So good that FBS traders can open both buy and sell trades. Besides, it can be also a negative factor for chip producers such as Nvidia and AMD as demand for GPUs is going to drop in China and press the prices of GPUs down.

Tech outlook​

Bitcoin has dropped to the support level of $41,000, which lies at the 50-day moving average and the 50% Fibonacci level. It makes this level a strong barrier, which the cryptocurrency will struggle to break on the first try. If it manages to cross, BTC/USD will plunge to the 61.8% Fibo level of $38,000. Resistance levels are $44,000 and $45,500 (the 200-day moving average).


BTCUSDDaily (1).png


Reference: FBS (24.09.2021) Crypto becomes illegal in China. FBS analytic news.
 
Like oil, natural gas is a product of decomposed organic matter, typically from ancient marine microorganisms, deposited over the past 550 million years. Often, gas and oil are neighbors, who are located deep under the ground. Because of that, their prices sometimes correlate. But for the last several weeks gas was skyrocketing at an enormous pace. It has gained more than 17% from August 18. What is the reason for such moves and how can we earn on global gas trading?

## Latest news:

* Hurricane Ida shut down oil and gas production.
* OPEC+ meeting is expected to stall oil production increase.
* Natural gas prices have risen sharply over the past week, with futures hitting two-year highs due to rising inflation and continued production cuts.

## What affects the gas price?

Assessment of the Natural Gas market should start with basic points. Usually, there are a set of reasons for the commodity price to change:

* The law of supply and demand regulates prices, as it does in nearly all commodities.
* As a longer-term general trend, the supply of high-quality oil and gas is fixed while global demand is increasing with a rising population and economic growth.
* There is a growing consensus that the world is facing a structural shift, driven by the energy transition and companies’ desire to reduce their carbon footprint.

Let’s go through every reason to create a natural gas price forecast. As for now, demand isn’t showing any signs of slowing down. Between 2009 and 2020, global gas consumption surged by 30% as utilities and industries took advantage of booming output. Even in the covid-19 environment, experts are expecting the demand to rise even more in the next 10 years.

As for ecological reasons, companies and countries are implementing gas in their electrical supplies. The shift to natural gas can be done relatively quickly and cheaply while having a significant impact on lowering emissions. Natural gas is the cleanest burning fossil fuel and emits almost 50% less CO2 than coal. Meanwhile, non-fossil-fuel alternatives such as wind and solar are at a relatively early stage to produce enough energy and offer a cheap deployment.

## Gas’ bright future

Already, there are signs around the world that supplies will fall short:

* Beyond a massive expansion in Qatar, few new liquified natural gas (LNG) export projects have been started since 2020.
* Government is uncertain about emissions-reducing policies, thus, producers have been less willing to sign long-term supply deals.
* Key pipeline projects struggle to move forward, and drillers are under pressure from investors, that want to avoid a surplus of gas. Moreover, major producers of natural gas are having too much power in their hands. That gives them the opportunity to control prices remove weaker competitors.

Even if the prices will rise even higher over the next decade, it won’t be enough to drastically reduce demand for the fuel. All we can say for now is that gas is increasingly less dependent on oil prices and this trend is going to continue.

## Technical analysis

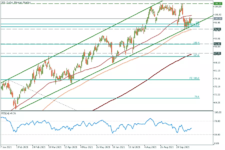
As for the chart, US natural gas is several days away from volatility increase. For now, the price is consolidating in a triangle and the breakout will decide its fate. In case of further growth, it is highly likely for the RSI divergence to form. That would be a sign of a pullback.

*XNG/USD H4 chart*

*Support: 5.60; 4.94; 4.20*

*Resistance: 6.30; 6.50; 7.00*

To trade natural gas, we need a trading strategy. And to have one we need to better understand the asset. Here are some tips for traders that will surely help you.

* Look through [short-term energy outlook] articles on our site to be in touch with the latest trends.
* To calculate your risks, it’s wise to check
* Analyze related assets, like Brent and Crude oil. The price tends to correlate between them.
* Use technical analysis and define the support and resistance levels for the price.

If to perform trade analysis via technical indicators, the best for gas right now is RSI, because it can show you the divergences between the indicator and the price and spot possible reversal earlier, than others.

No growth is everlasting, and though the gas price has been skyrocketing for the last weeks, most of the time it lacks the volatility. So when this “Gas season” will be over, consider looking at the [cryptocurrency] because it’s much more volatile. Also, 24\7 crypto trading means that you don’t need to wait for the market opening, just open your FBS Trading Platform or Meta Trader and enjoy the possibilities of a [crypto trading account]

Now you know how to trade natural gas, so what are you waiting for?

1633521188173.png


Reference: FBS (05.10.2021) Gas lights up. FBS analytic news.
 

What affects oil price?

Oil is one of the most important assets, which presents the whole economic situation in the world. Just like the prices of most assets, oil price depends on the demand-to-supply ratio. During periods of economic growth, countries increase demand which leads to price gains. On the contrary, when the economy enters a regression phase demand drops and price follows it.

How to trade crude oil online?

There are two ways of trading crude oil online. You can trade contracts for difference (CFDs) or futures. While CFDs display the price in real-time, futures predict a future price change. Futures are the most volatile and risky instruments as they can be manipulated by traders with high capital. During March 2020 collapse Brent futures have been trading under the $0 level, while CDFs only reached $17. That is why we believe that trading contracts for difference is less risky.

You can trade oil and energies contracts for difference with FBS. Learn the contract's specifications and pick the best option for your trading strategy!

When is the best time to trade oil?

Oil price is influenced by the Organization of the Petroleum Exporting Countries, that is why the meetings and statements of this organization make a huge impact on an oil price movement. Their statements raise oil price volatility, but moreover, they define the future trend. That is why the best option for trading oil is to wait until one of this OPEC’s meetings or statements and follow the trend.

Another highly important data, which usually influences the price, is the US crude oil inventories data as the United States is the largest exporter of crude oil. Bigger reserves mean that the oil consumption stays under pressure, which is the first sign of upcoming economic stagnation. On the other hand, lower-than-expected reserves data points traders to the fact that the consumption grew in the past and the necessary replenishment is needed. In this case, additional purchases will stimulate oil price increase.


OPEC+ said it had “reconfirmed the production adjustment plan”, which referred to its previously agreed decision to add 400,000 barrels per day to the market for November. The recovery in global oil demand from the coronavirus pandemic has been quicker than many expected, while global supply has been disrupted by hurricane outages and low investment. As long as these two factors remain unchanged oil will gain constantly.

XBRUSDH4.png


Brent's price is moving in the rising channel. The bearish divergence occurred on the RSI chart, that is why expect a tiny correction to the $79.8 support level. After that, the price might reverse and head towards $86.3, where the 2018 high locates. To break this level buyers need to get some strong news, which will act as a buy signal. Without them, the price will get rejected from the $86.3 level and solid correction will happen.


Reference: FBS (06.10.2021) How to trade oil. FBS analytic news.
 

What is happening?​

Just look at the charts above – the Canadian dollar has skyrocketed! Such strong growth has been caused by several reasons.

First, oil prices have gained from the global energy crunch. Crude oil has hit the highest level since 2014 as the demand is growing ahead of winter, while OPEC+ doesn’t rush to increase output significantly. Canada is one of the world’s largest oil producers and its currency has historically positively correlated with oil prices.

Second, Canadian employment figures came out better than analysts forecasted on Friday. It can signal another taper from the Bank of Canada later this month, which may push the CAD up. Just to remind you, the BOC was the first bank that tightened the policy after the Covid-19 crisis. Thus, it’s quite reasonable for the bank to continue tapering after a strong job report. Meanwhile, the US has revealed the worse-than-expected NFP numbers. Canadian Dollar strength and US Dollar weakness pressed USD/CAD to its lowest level since July.


Tech outlook​

USD/CAD has broken through all the moving averages and the support line while moving down. It has stopped ahead of the support level of 1.2445 – the July lows which the pair has failed to cross and reversed up. Let’s wait for a breakout. If it occurs, the pair is likely to drop to the psychological level of 1.2400. However, before the breakout happens, we might see a pullback to the 200-day moving average of 1.2500.
3.png


Reference: FBS (11.10.2021) All is good for canadian Dollar. FBS analytic news.
 
Over the last 18 months, governments have printed an unbelievably large amount of money. And while these measures help the economy to rise and thrive, the consequences can be severe for everyone. Let’s discuss, what role do banks have in all this and how can we forecast their future actions and stock price’s prospects.

Banks during the Covid-19​

As one of the crucial members of society, financial institutions have several main functions to maintain the economy in a good state. During the pandemic, banks have been active on a number of fronts. Among them are:

  1. Providing cash flow support. Governments implementing lockdowns mean businesses and individuals are being starved of income. Expenses, however, still have to be met. Since the biggest cash outflow for individuals or small and medium-sized enterprises (SMEs) tends to be for a mortgage or some other loan, banks have announced moratoriums on interest and principal payments until the year-end. This is affecting the overall banks’ income badly, but government helps banks by printing more money.
  2. Change of lending rules. In 2019 interest rates on bank credit to the private sector in the US was 5.5%. Now it is around 3.25%. The Government has stepped in to cover risk up to 80% of some SME loans. This improves a bank’s ability to give a loan to the borrower.
  3. Helping customers do their banking digitally. With employees working from home, it makes no sense to still have to go to the branch to carry out banking transactions. Also, it is a safety issue.
In a nutshell: banks were trying to help SMEs amidst lockdowns and sharp reduction of economic activity. Their goal is to maintain as many payrolls as possible and keep the unemployment rate under control. That’s why we are watching after NFP data closely, it reflects broad market conditions.

The post-pandemic era​

Banks’ stocks have risen for the last year and a half because of:

  • Government, that printed trillions of dollars and stimulated the economy.
  • Banks’ investment activity. The stock market soared, alongside banks’ profit.
  • The rapid growth of the deposits in the banks. Only in Bank of America the overall amount of deposits have increased by 20% for the last year and has almost reached $1 trillion.
Moreover, there are prospects for banks to gain even more. Accelerating economic recovery contributes people to borrow more money, though, not as much as expected. As the result, banks gain the potential to increase their buyback programs. Morgan Stanley and Wells Fargo were among the banks that said in June they would increase dividends and buy back more of their stock. Collectively, JPMorgan, Bank of America, Wells Fargo, and Morgan Stanley have announced they’ll repurchase $85 billion in shares.

It would be weird not to mention the consequences of rate hikes. As the banks now have enormous sums of money in loans, and floating rates are used widely, raising the federal funds rate by 1% will result in billions of dollars profit in a matter of a year. And we know that rate hikes are just a matter of time.

What now?​

The nation’s biggest banks are about to report profits, and for behemoths including JPMorgan Chase and Goldman Sachs they are expected to fall when the banks report third-quarter results this week. As we can see, rapid growth in S&P 500 earnings will decrease over time as tapering comes into full strength.
This week, 6 biggest banks will release their quarterly earnings report, including:

  • JPMorgan Chase (Oct 13), expected to lose 3.7% revenue growth,
  • Bank of America(Oct 14) expected to lose 0.2% revenue growth,
  • Citigroup(Oct 14), expected to lose 15.5% revenue growth
  • Morgan Stanley(Oct 14), expected revenue growth at around 11.8%
  • Wells Fargo(Oct 14), expected to lose 9.0% revenue growth
  • Goldman Sachs (Oct 15), expected to lose 8.8% revenue growth
Notice, that you can trade these banks’ stocks with FBS!

It’s understandable for banks to lose the pace of growth. Previous reports were positive due to stimulus, but the time of trillion-dollar money printed out of thin air is gone. Current supportive measures just aren’t strong enough to increase banks’ revenues compared to last quarter. What is in our sphere of interest, though, is Morgan Stanley, which is expected to increase revenue. We suppose the following reasons:

  • The growth was complemented by a rise in wealth management revenues. Notably, the wealth management total client assets received a big boost from the acquisition of E*TRADE in the last quarter of 2020 and may continue now in the light of unending growth in broker companies’ clients.
  • Asset management and related fees increased because of the Eaton Vance acquisition and higher AUM (Assets under management).
If to say for the whole financial industry, the end of the pandemic will keep the Covid-19 legacy. We are talking about the transition to online banking and the increase in the number of retail investors and traders, who are trying to deal with the market by themselves. This, in turn, will help the banks to refrain even against tapering and rates hikes.

Morgan Stanley daily chart

Resistance: 106.0; 109.0; 125.0

Support: 96.5; 91.0; 87.5


At the end of the day, banks anticipate rate hikes, so future tapering doesn’t seem to be so crucial for them. For now, expectations from the reports are mostly negative (Morgan Stanley is a reasonable exception) due to stimulus reduction. What’s more important is the bank’s forecasts of their future revenues. We will hear from them shortly. As for now, it is a perfect opportunity to consider increasing the bank’s share in your investment portfolio.

MSDaily.png


Reference: FBS (12.10.2021) It's all about those banks. FBS analytic news.
 

Attachments

  • 1634083825885.png
    1634083825885.png
    313.6 KB · Views: 85
Top