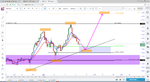
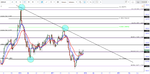
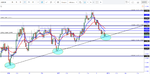
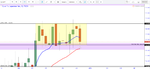
The week has started off bearish, this shouldn't be a surprise as bullish price action has been over extended, so a bearish reversal was due at some point. The 8MA and 18 MA are still proving to be solid supports on the daily time frame, suggesting the overall bias remains bullish. However, price failed to break the weekly key resistance 1.8000 on Friday 8th, even failing to make a high above it and the day closing as a shooting star candle. The overall week closed as a potential spinning top, which spells indecisiveness, could this be the end of GA's bullish run. Not necessarily, as we have had a few spinning tops in the last few weeks that have been followed by more bullish price action.
The weekly time frame which has been making Higher Highs followed by Higher Lows for the past year, is currently in search for a new Higher high. Previous weekly higher high dipped above the monthly key level 1.7500 but failed to break above it. Current weekly price has failed to break our weekly key level 1.8000, and could have potential have formed a new higher High. This weekly level makes for an ideal Higher High, the only other being potentially the weekly fibb 0.27% extension which has not yet been fulfilled, this being 1.8135.
With this in mind, although short term price remains bullish, trade with caution and be on the lookout for major bearish reversal opportunities. Look out for 3pin candle formation, daily MA crossover to the downside but bear in mind that the weekly close will be the most key factor, a failure to close above 1.8000, suggest the bears are back in play.
11 Dec. 17
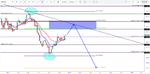
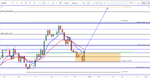
The day has closed bearish and completed a 3Pin daily formation. This candlestick pattern could potentially mean there’s more bearish momentum still left or it could signal a major bearish reversal in search of a new weekly Higher Low, this being potentially the monthly support 1.7500. However as overall bias remains bullish, I’m looking for long opportunities with my upside targets being the weekly level 1.8000 which is also the current Higher High. A bullish reversal on the 4H chart which respects the fibb zone will be an ideal reversal alert. However, as the daily 3pin pattern on the weekly resistance could be signalling a long term change in sentiment, it’s worth waiting for bullish daily triggers before entering long (patience is key). I will enter long if a combination of the following takes place.
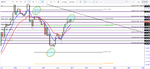
A bullish break back above MAs on the 4H followed by a crossover
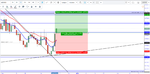
Failure to break daily support 1.7676
Fibb zone respected by price action
A bullish daily close, MA wick rejection
Happy Trading
👍
RJFX
The weekly time frame which has been making Higher Highs followed by Higher Lows for the past year, is currently in search for a new Higher high. Previous weekly higher high dipped above the monthly key level 1.7500 but failed to break above it. Current weekly price has failed to break our weekly key level 1.8000, and could have potential have formed a new higher High. This weekly level makes for an ideal Higher High, the only other being potentially the weekly fibb 0.27% extension which has not yet been fulfilled, this being 1.8135.
With this in mind, although short term price remains bullish, trade with caution and be on the lookout for major bearish reversal opportunities. Look out for 3pin candle formation, daily MA crossover to the downside but bear in mind that the weekly close will be the most key factor, a failure to close above 1.8000, suggest the bears are back in play.
11 Dec. 17
The day has closed bearish and completed a 3Pin daily formation. This candlestick pattern could potentially mean there’s more bearish momentum still left or it could signal a major bearish reversal in search of a new weekly Higher Low, this being potentially the monthly support 1.7500. However as overall bias remains bullish, I’m looking for long opportunities with my upside targets being the weekly level 1.8000 which is also the current Higher High. A bullish reversal on the 4H chart which respects the fibb zone will be an ideal reversal alert. However, as the daily 3pin pattern on the weekly resistance could be signalling a long term change in sentiment, it’s worth waiting for bullish daily triggers before entering long (patience is key). I will enter long if a combination of the following takes place.
A bullish break back above MAs on the 4H followed by a crossover
Failure to break daily support 1.7676
Fibb zone respected by price action
A bullish daily close, MA wick rejection
Happy Trading
👍
RJFX