ImogenBeaumont
Junior member
- Messages
- 46
- Likes
- 6
I’ve noticed that a lot of traders constantly switch indicators when a setup stops working for a while. I’m curious about the opposite: the tools that have stuck with you.
Hi i never switch the indicators i use.I’ve noticed that a lot of traders constantly switch indicators when a setup stops working for a while. I’m curious about the opposite: the tools that have stuck with you.
Keeping the same tools but giving each a clear role makes a lot of sense.Hi i never switch the indicators i use.
The main ones for me are the Rate of Change, the Donchian Channel and the Williams%R..I use these across the various strategies i use
The rate of change to measure the relative strength of asset class and trend, the donchian for risk management, and the williams%R also for trend
Everything ultimately resolves back to price. What’s interesting is how you’re framing it less as a single indicator and more as context: structure, time, speed, and relationships. Do you formalize any of that into rules, or is it mostly discretionary reading of price behavior?Only one, price, price at suport and resistant, price moving up, price moving down, price moving sideways, price moving at different speeds, price moving at different angles, price breaking out, price retracing, price hitting new lows or highs in differing time frames.
Price at different times of day, price at different days of the week. Price at different times of news releases Price at different times of unplanned news. Price compared to prices of other instruments, price compared to the dollar.
Really like that approach! For me, just watching price like how it moves, reacts to news, hits support or resistance has been just as reliable, without faffing about with different indicators.Hello Imogen
I hope you don't mind my using what I believe is your first name. I don't want to be disrespectful
I was taught by an institutional professional to use VWAP and Volume Profile. They provide consistent
value and a stable edge. Interestingly, when my system fails, it is usually me (operator error).
I was also taught to identify "repetitive behaviors" (price patterns that repeat). I realize that this is not
an "indicator" per se, but, it over the years, this technique has also provided a predictive (and stable) edge.
And finally, I have learned to enter trades "early". Again the Professional who taught me (years ago) called
this "Blind Entry", and his reasoning was that this technique although considered "aggressive" provides two
benefits as follows. 1) when you are wrong, you know it right away and can take measures to minimize loss
2) when you are right, early entry maximizes profit, and allows the aggressive trader to exit right about the
time when less skilled operators are entering. While it may seem counterintuitive, remarkably these two
techniques (identifying repetitive behaviors and "blind entries") combine to produce a result that has been
consistent over many years.
I will attach a chart that illustrates (some of) the points mentioned
Good luck
Rules yes but not in the way you think.Everything ultimately resolves back to price. What’s interesting is how you’re framing it less as a single indicator and more as context: structure, time, speed, and relationships. Do you formalize any of that into rules, or is it mostly discretionary reading of price behavior?
Hey StevenRemarkable
"Three ways that professionals make their money". I'm sorry, just not close to the truth.
As regards the comment about "consistent money" from directional trading, again not even close.,
Skilled professionals learn to identify regime (condition). A simple example is to identify whether
the majority of volume executed during previous market sessions occurred above or below
a key reference. This tells us which side is vulnerable (longs or shorts). From that we know that if we
wait patiently, at some point a precipitating event will occur, and the vulnerable side (already underwater)
will have to take action to cut losses, Professionals have a phrase for this ("waiting for the Give Up Bar")
We wait, identify that condition, then execute, manage and exit.
I have been trading the New York Session of the S&P 500 Futures for 18 years (at Christmas). Making a living
from "directional" trading, with the goal to obtain 10 point swings. I certainly do adjust to changing conditions
and may be required to take smaller (scalp) trades on a given day. Those trades are generally +3 pts minimum.
I am able to realize my goal on average 3-4 days a week. I know of no professionals who trade "the spread" as a viable way to
make a living. That arena is dominated by automated programs and institutions that "co-locate" their offices near to the
exchange to obtain an edge, not by humans.
Interested traders can refer to my thread "A Professional Approach to Trading", where I post charts.
Good luck
Thanks for the detailed explanation.Hello stat_trader
I am not sure if your question was directed to me?
I review back about 30 days in order to identify "Repetitive Behavior" (I have referred
to this previously, many times). I think in terms of synchronicity for example if price
action was affected by the release of high impact economic news, then I would
immediately dial back to the previous release to see how the market reacted then.
Depending on what I see, I then have a point of reference. And here I will provide
something that normally I reserve for my class. It is called the "2 day rule".
Professionals know this, however, Retail traders should keep in mind that this is not a hard and fast practice. For those who have enough
- Avoiding the Noise: High-impact economic news creates significant initial volatility and potentially large, erratic price swings as the market digests the data. The "2 day rule" is a risk-management technique to let this initial flux settle and observe the genuine market direction after a more rational response takes hold.
- Breakout Confirmation: The rule is specifically used to validate breakouts from key technical levels. It requires the price to penetrate a support or resistance level and then close beyond that level for two consecutive trading days to confirm the move as legitimate rather than a "false breakout" or "head fake".
- Institutional Discipline: For institutional desks, this rule enforces a disciplined approach, preventing impulsive moves driven by short-term emotional reactions that often characterize retail trading immediately after a major release (e.g., NFP, CPI, or FOMC announcements).
capital and are not risk averse, you may also want to refer to a practice by "TraderTom" Hougaard. He uses a setup called "Rule of 4"
While I respect the guy's achievements, when I review using data from the S&P Market, it does not seem to work very well. Perhaps
in Forex Markets, the result might be different. Always test before accepting risk.
Finally to answer the specific question stat_trader, I do not trust third party vendors to provide accurate data dependent services
I trust myself.
Good Luck
Thanks for the heads-up.Hello stat_trader
You may want to take a look at the thread "A Professional Approach to Trading"
where I started my LiveStream today. The trade setups might be of interest to you as well.
Also please note, some folks have left the presentation. This is expected, since it is 5:30pm in
London and they are heading off to supper or dinner. Here in the US, it is 9:30am and we
are monitoring periodically to see whether a breakout occurs. At this point we have identified
a regime known as "Trending Trading Range", and it is sometimes the case that institutions
will stage inventory preparatory to reversing the market (and trapping shorts)
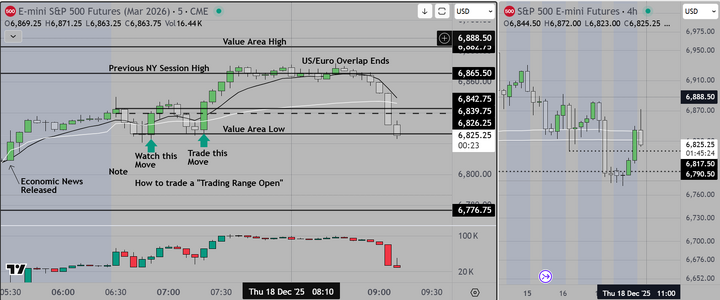
Summary/Regime Identification
First Hour/"Initial Balance"
1) At the open, Breakout to the upside (failed) followed by
2) Reversal to test VAL,
3) Reversal as buyers came in at VAL, creating a Trading Range, followed by
4) Retest of VAH.
During this time period, the Nov Pending Home Sales was released and was positive
and the Dallas Fed comment was released.
Skilled traders would have figured this out quickly. Automated Algos would have been
triggered by specific words in each release. Here is the text
- Driving Factors: NAR Chief Economist Lawrence Yun noted that improving housing affordability, driven by lower mortgage rates and wage growth, helped attract buyers back to the market.
Good luck
I really don't think you have understood my message at all.Remarkable
"Three ways that professionals make their money". I'm sorry, just not close to the truth.
As regards the comment about "consistent money" from directional trading, again not even close.,
Skilled professionals learn to identify regime (condition). A simple example is to identify whether
the majority of volume executed during previous market sessions occurred above or below
a key reference. This tells us which side is vulnerable (longs or shorts). From that we know that if we
wait patiently, at some point a precipitating event will occur, and the vulnerable side (already underwater)
will have to take action to cut losses, Professionals have a phrase for this ("waiting for the Give Up Bar")
We wait, identify that condition, then execute, manage and exit.
I have been trading the New York Session of the S&P 500 Futures for 18 years (at Christmas). Making a living
from "directional" trading, with the goal to obtain 10 point swings. I certainly do adjust to changing conditions
and may be required to take smaller (scalp) trades on a given day. Those trades are generally +3 pts minimum.
I am able to realize my goal on average 3-4 days a week. I know of no professionals who trade "the spread" as a viable way to
make a living. That arena is dominated by automated programs and institutions that "co-locate" their offices near to the
exchange to obtain an edge, not by humans.
Interested traders can refer to my thread "A Professional Approach to Trading", where I post charts.
Good luck