Best Thread Follow the Smart Money / COT Analysis

The first market that was mentioned in this review (see my previous post for the video) was the sugar market. I think it is a great example for those of you, who would like to understand how to use the COT change indicator, what does a specific change size mean.

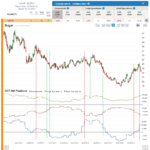
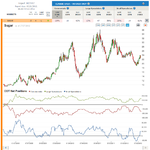
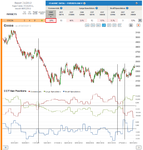
The sugar market’s 20% change (on a 52-week range)in Commercials positions illustrates well that a 20% change may be considered large in one market, while in another market it happens pretty often, so it might be negligible there. You have to go back in time and see if that change size is really significant or not.

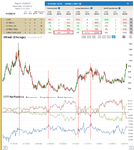
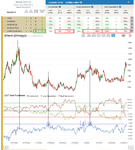
If you look at the 1 year chart below, you will find that similar or even larger changes have happened in the past and not that rarely. Now does this mean that this 20% change will not have any effect on the price? Well I’m sorry to say this, but you have to do your homework, do a little historical analysis. I have indicated on the 1 year chart those situations when there were similar changes. I would say that roughly 70% of the time, such a change size had an effect on prices. Ok, now you might ask, whether this time it would have an effect or not. My answer to this question is: I don’t know. It’s all about chances… I think – looking at the chart – that this change size could move prices lower in the near term, but if you have a look at the 5 year chart, you can see that we are not at an extreme COT level for neither market participant, which makes it more difficult to predict a direction.

Besides understanding to read COT signals and see what effect they might have on prices, I think it is also very important to know when to step aside from a market.

I’m not saying that Sugar does not have opportunities, but I think one should always consider the risk/reward of the trade and search for those few markets where this ratio is more favorable.

I’m personally looking for those situations when the picture is very clear, and you don’t need to do much thinking :)

All the best,
Dunstan

New to COT? Read my first couple of posts in this thread or check out this video for more info
 
sorry, I forgot the two charts :confused:
 

Attachments

  • Sugar 1yr.png
    Sugar 1yr.png
    207.7 KB · Views: 403
  • Sugar 5yr.png
    Sugar 5yr.png
    219.9 KB · Views: 348
The Chicago Wheat -->

The latest report showed that Large Speculators are at All Time, Commercials are close to All Time Extreme levels. I have indicated on the chart for you similar situations in the past, when the picture was same/or/similar.

Of course as I have said before, since COT analysis is not a tool to be used on its own, one should not think of this as a signal to go short, at least not right away, but it definitely signals a high level of stress in the market, which could support a bearish move soon.

So if your system allows you to go short on this market, you would definitely have some sort of support from the COT data OR if you just found this opportunity by the usage of this report, you could analyze it, whether your system allows you to enter or not.

All the best,
Dunstan
 

Attachments

  • Wheat.png
    Wheat.png
    131.9 KB · Views: 409
Thanks for your efforts Dunstan, I really appreciate it! I was always really interested in the COT report, I think I need to dig a bit deeper now, it sounds very useful to me. (y)
 
Thanks Samy32 for the compliment! :smart:

One of the most exciting markets that was mentioned (recent review), is the Wheat (Chicago), so today I’ll talk about this market.

On the attached chart I think even someone new to the report should see that we are at an All Time (or to be precise, close to All Time) extreme picture in the Commitments of Traders report on Wheat. It is only the Small Speculators who “still got space” to become All Time extreme, but still they are also very extreme.

I have also drawn on the price chart those places in time, when the COT picture was similar. This picture that we have now can definitely be considered a good signal from COT.

Now obviously I cannot say that this is the time to go short, it is up to you to decide how you wish to interpret the signal, all I’m saying is that the stress level in the market – as cleverly used in the review – is becoming extremely high. It maybe that prices continue further up for a few more weeks, I don’t know, but I do know that it will be this market that I will closely monitor in the near future.

I know that there might be traders now who are viewing my thread and are not comfortable trading futures or options on futures, so my note to them is this: there are ETFs (a great list here) that follow futures contracts and can be traded just like stocks.

The three Wheat ETF that I found:
WEAT: direction - Long / leverage -1x / exchange - LSE
SWEA: direction - Short / leverage -1x / exchange - LSE
LWEA: direction - Long / leverage -2x / exchange - LSE

Please let me know if you have any questions,
Have a great day,
Dunstan
 
sorry, I forgot the chart :)
 

Attachments

  • report31_Wheat.png
    report31_Wheat.png
    131.2 KB · Views: 375
Ok, I thought I’ll show you another market as well, since you might say, that I’m talking too much about wheat :)

Cocoa was also mentioned in the review, cause the change size in Commercials position was larger than average. It was 28% to be exact. Now this market could be a good example, how to react to a market, where we haven’t got an extreme COT picture. It is only the change in positions that was such that we can talk about it.

I think you should follow the same notes I’ve given earlier, to view this as a confirmation to your existing trading idea or it might just signal an opportunity that you should put in to your system and see whether it should be traded or not.

In the following chart I have indicated similar pictures when Commercial’s changed their net positions this way. I wouldn’t say that this signal is as strong as the one in wheat. If prices react to this and they start to fall, they might just fall to 2000-2100 level, but hey (!), if they do that and you’re in, that’s “fair enough” :). Maybe we would get to a level in COT where it is signaling a good buy opportunity…

The four Cocoa ETF that I found:

NIB: direction - Long / leverage -1x / exchange - NYSE
COCO: direction - Long / leverage -1x / exchange - LSE
SCOC: direction - Short / leverage -1x / exchange – LSE
LCOC: direction - Long / leverage -2x / exchange – LSE

Please let me know if you have any questions,
Have a great day,
Dunstan
 

Attachments

  • report31_Cocoa.png
    report31_Cocoa.png
    82 KB · Views: 384
This is not new, the COT report has been out for decades and is available to anyone. If you think that can give you an edge you are having a laugh.
 
Hi MacroStyle,

Thank you for your view on the topic. If I may reply to the two points of yours…

First of all, you are right that the report is not new and that it is available to anyone. I have never said that the report is new and I have precisely given the source (CFTC) where it can be found. Second of all, your view is that the COT report cannot give a trader an edge, so to say, knowing that for example Commercial participants in the Wheat market are net short 40.000 contracts and that Large Speculators are holding so many contracts net long as never before… that this information is irrelevant? Well I don’t think so, but it is the freedom of any trader to decide what information they believe has value and what does not. My view is that these kinds of information contain value which can help achieve better results in trading.

To get back to your first remark, I think that just because the report has been out for such a long time does not necessarily conclude that everyone should know about it. In my experience, talking to dozens of traders, the majority of them have never even heard about the report. I’m glad that you are not one of them and actually I would much appreciate it if you could share with us your experiences using the report in your trading. Maybe by doing so, I could highlight you some mistakes that you might have made in the implementation of the report, thus you might change your view on the usefulness of the report in time.

Have a great day,
Dunstan
 
Dunstan,
Please ignore the silly remarks on this thread and continue.
I find your analysis and comments enjoyable, educational and useful
You are doing a brilliant job !
Thankyou for the time and effort you put into it.
 
Hi justtrader,

I’m very happy that you are satisfied with my thread, I’ll do my best to keep it that way :)

Thanks for your support,
Have a great day,
Dunstan
 
The information within the report is relevant but because its used by the majority of major market particiants i have never found it that useful in terms of actual trading.

I have previously used the data in the following way:

(Large spec longs - large spec shorts) / open interest then normalised over a 5 year period using a percentile method. The idea being to call tops and bottoms when specs are max long or short.

I made a spreadsheet a few years that feeds all the data in from bloomberg and does the calcs for all the contracts.

Hi Macrostyle,
Would be kind enough to post a screen shot of your excel sheet for me to get a better understanding.
 
A second thought if you are interested in market positioning and sentiment I do find EPFR fund flow data and the Daily Sentiment Index survey data quite useful although you do have to pay for both of these.

Fund Flow data because EPFR cover the majority of retail investment funds and provide daily subscription and redemption data and monthly sector allocation data. I have found this alot more useful when trying to work out what 'real money' is doing.

The Daily Sentiment Index is a daily survey of locals on the exchange and it covers most futures in the US and on European exchanges. I find it a good approximation of 'fast money' and because it is a daily survey indicates sentiment more quickly and accutately than the COT report.

I work for a Hedge Fund so have subscriptions to both services, not sure how much its cost. Probably too much for retail guys unforunately...
 
Couldn't find the original sheet so I have attached an example for S&P E-mini. It uses a Bloomberg feed so if you don't have a terminal its not gonna update.
 

Attachments

  • COT Example.xlsx
    33.3 KB · Views: 475
Thanks for your posts regarding this topic.

I have follwed the COT in the past but due to the nature and delay of receiving this information it is still difficult to obtain any specific type of edge.

My take on it was that if the non coms (speculators) were trading at extremes the theory would be that they would have to sell if they were at long extremes (and vice versa) . I was looking at ratios of around 3:1 on a weekly basis.

The main problem with this is that you would need to have pretty wide stops in order to try and develop an effective trading plan.

Could you give an indication what your TP targets and stops are?

Thanks

Mick
 
Hi MacroStyle,

Thank you for the more detailed explanation on why you find the report not as useful.

The tools I’m using are provided by a service that I’ve been using for over 8 month now. I haven’t found anything similar elsewhere yet and unfortunately I do not have the capabilities or experience to prepare such a system on my own, so I was really glad to find it. Before, I just looked at the COT charts, but with the Analysis table at COTbase I can easily find great signals.

You said that you basically used only the COT data of the Large Speculators, but I think that in this way you were “covering an eye”. I believe that looking at also Small Speculators and Commercial participants would show you the full picture.

The Daily Sentiment Index that you mentioned sounds interesting but as I see it, it concentrates on Large Speculators, while the COT report shows you the positions of all “players”. It would be nice to know how this Sentiment Index is prepared, what input data is required.


Hi mik1973,

The COT report comes out weekly now, but it used to come out only every two weeks and before that only on a monthly basis. I hope that this trend will continue and maybe one day we shall have daily COT reports.

It is true, that the COT report serves much better those traders, who trade on a longer time-horizon, for more active traders who might trade intraday the report might not have such a value.

In general you are right, that purely on COT report based trades one might have to use wider stops. I think this is the case at extremes, for example in the Wheat market that I mentioned earlier. Although we are at close to All Time Extreme levels, the COT charts could easily widen more for a few weeks, so it isn’t that easy. For the Cocoa example, where it was the COT change size that was significant you could take a closer stop, since the signal should take effect sooner.

I would rather not go into more detail now, how I would enter/exit a trade, use stops etc… cause than I would be narrowing down the usage of COT analysis to a specific strategy that I use. As I have said it a couple of times before, I urge anyone interested in the report to try to implement it in their own system and see whether it would produce better results overall.

I know it might be a disappointment to some of you seeking system recommendations from me that I don’t provide any, but my goal with the thread was purely to introduce the report and some analysis tools on it to those who have never heard about it before (read post #10). Of course anyone who wishes to share their system using the COT report is free to do so and I’m willing to discuss any specific trading opportunities one brings, of course from the perspective of the COT report.

I hope you won’t lose interest in my thread just because I’m not giving live calls and I hope that the examples I’m bringing should “ring the bell” when seeing them… It should be quite obvious that my two last examples from the recent COT report could be considered valuable signals that one might see as an opportunity to trade…
 
Dunstan

The DSI can be found on Jake Bernstein on Futures, the site doesn't look very professional but the data is pretty widely used (I was put on to it by a Merrill Lynch research report).

I focused on the large speculators because the other two groups (small spec and commercial) usually just have the opposite position. Which makes sense because by definition the overall position across all three groups has to be flat.
 
Top