Flatline....

FetteredChinos

Veteren member
Messages
3,897
Likes
40
ok, the patient is dead....


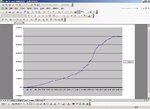
attached is an equity curve of a home-grown trading strat tested on data as far back as 1990.

the inputs (all two of them) are dynamic, and so should therefore respond to current prevailing market conditions..

it is counter-trend..


performance has been rather stellar (50pts per trade, 80% win rate), until we hit 2004, whereupon it has basically flatlined.

this...
is...
annoying....

looks like 60,000 points is providing overhead resistance.. :rolleyes:


anyway, the point of my posting was..

has anyone come up with a decent mechanical strat that has performed well on the Dow during 2004? all my trend-following ones have got a similar pattern, as have my counter trend ones.


it cant be due to current market volatility can it, as the inputs are based on recent volatility levels......?
 

Attachments

  • flatline dow.jpg
    flatline dow.jpg
    81.4 KB · Views: 373
Fettered, you are giving them riddles to solve ~ they don't like this, you know they don't.
Some bright spark is going to suggest something unworkable, just for the sake of it....
Actually, there is no difference, because if you presented the chart upside down, it would be
likely to have the identical effect. <g>.
 
Have you had a look through the trades to see how it is failing?
It is quite likely that the inefficiency it was using has just been traded out, probably never to return.

This type of problem happens to every trading system which is why I run at least half a dozen at a time so if one or two hit the ceiling the portfolio still makes money and I can replace the dead systems with fresh ones.

At least flatline is better than a loss.
 
true, and i see where you are coming from..

what im trying to get at is that something other than volatility drying up has changed in the markets over the past 18 months or so, and im trying to work out what it might be.

was looking at the monthly ranges on the dow earlier today.. ranges of 1200 points were not uncommon a few years ago....

(sigh)
 
agreed jm...

at the moment i am trading a method or two based on the fundamental principles of this strategy.. so im using the discretionary side to turn the flatline into a (very slight) up-slope..

its annoying though, as im a big fan of set and forget systems.. :(
 
Well, now that the thread is started and you are getting responses, I bet you are pleased, I remain an observer with interest to see how this develops. The truth is, I myself do not know
how to solve this one.
 
FC - it's fractal.

Take any smaller timeslice and enlarge.

Socrates was close to it without realising it. You could present it upside down and it would still be fractal.

I don't 'do' plug-n-play - far too many dynamic events & variables to leave to a totally mechanistic system approach.
 
Last edited:
hmm interesting brambs..

so you mean, if i broke it down to an hourly level , for example, it would exhibit the same characteristics?
 
I'm saying a quick look at the graph you provided showed similar 'patterns' of the whole throughout. I counted half a dozen without squinting.
 
ah now i get you.. mini flatlines throughout the entire curve.. interesting...

so on the huge scheme of things years from now, we could end up with a whopping great flatline as this particular inefficiency gets eroded completely

interesting..


might as well stick all my money in a savings account now....
 
Yeah. As JMR mentioned, any 'set' system is going to become inefficient - but not permanently. It's not that 'the Market' gets wind of your system and changes. Or that other traders trade it and 'flatten' it.

It's just the normal 'Flow' of the market and it replicates itself over time.

It's important to understand I'm not talking about Momentum here. Momentum requires time, effort and energy (effort is actually a function of time & energy, but...). Flow requires nothing more than recognition. It simply IS.
 
hmm, thanks brambs..

the question is , can we quantify this "flow"?

or as a compromise, perhaps running a MA on equity would show us when the "flow" isnt in our favour...

the point i was trying to get at, was that this "flow" is currently aiding neither counter-trend, nor trend-following systems that i have looked at.

so where does this leave us? what other ways to trade are there? Trend-ignoring?

FC
 
You're not looking at a price curve FC - it's an equity curve. So look at what your system is 'trading'. That's the bit that isn't working as you expected.

You're making a distinction about the system - not price action.

You're also assuming it's not working in trend or counter-trend in all timeframes.

On the upside, an equity curve flat-lining is preferable to one heading South - n'est ce pas?
 
so on the huge scheme of things years from now, we could end up with a whopping great flatline as this particular inefficiency gets eroded completely

Or more likely you will end up with a whopping great loss and the inefficiency gets eroded completely.
 
yes i know, i know, but i want to eat my cake and have it...

the reason i mentioned the MA of equity, was that it may not be obvious to the human eye WHY the system isnt working..as you said, there are so my dynamics and variables to consider..letting the system tell you it isnt working is better than trying to second guess the markets?

the human brain is impressive generally, but not in my case..i generally like confirmation...


10710 for a Dow close this friday?
 
jmreeve said:
Or more likely you will end up with a whopping great loss and the inefficiency gets eroded completely.


erm isnt that only the case with trend-following??


if you buy and sell at random in the markets, the expectancy falls to zero before you take into account dealing costs...

when a system stops working completely, rather than entering a period of drawdown, then surely it is much the same as entering randomly?

:confused:
 
if you buy and sell at random in the markets, the expectancy falls to zero before you take into account dealing costs...when a system stops working completely, rather than entering a period of drawdown, then surely it is much the same as entering randomly?

If the entry/exit has become random due to the efficiency going away then you will loose your trading costs on each trade over the long run. Does your plot include costs?

Sometimes it can go the other way if the market has worked out that it can take money out of the pockets
of people trading the original system. This is not random but has turned your favourable efficiency into an unfavourable one.
 
Actually I confess not to be an expert in the field under discussion as I evolved a methodology very far removed from this arena.

But this perspective has been explored extensively before. The problem is that the nature of the perspective in itself is so complex that it requires a great deal of effort to get to grips with it properly. I decided a long time ago not to follow this route because of the amount of work involved in pursuing it to a condition that would make it universally workable.

In this regard the work of Jack Hershey in the United States comes to mind. The difficulty with his methods is that he tends wander from one aspect to another without providing links in the assumption that the trader already has the links. This makes it difficult to follow for most people, as he does not bother to explain the finer points and where the linkage exists. As the information he provides is not complete, it requires extra work to slot in where the links should be made plain, but I imagine that to anyone already following a parallel route this should not be very difficult.

I myself appreciate that for him to annotate every chart with detailed footnotes to illustrate the linkage would be a huge task that at his age he might not want to put in this kind of intensive effort, but I followed his post with great interest, as the conclusions he was able to arrive at are obtainable but via a different perspective which is essentially pure darksiding. What I mean is that a darksiding posture confirms what he postulates from a mechanical viewpoint, is absolutely correct, classic. But many do not understand all of what he posts for the reasons I mention above. This is a huge difficulty and a great shame.

Additionally he prefers to use his own definitions, which to many readers are baffling because they have to be deciphered first according to his frame of reference and not the reader's. But what he is able to demonstrate in mechanical form is totally harmonius with darksiding technique.

I hope this helps and is of use to you.
 
no, my plot doesnt include dealing costs....they are probably insignificant for these purposes..

but assuming 5pts per trade (very conservative, esp if trading DA) that still returns 54k points...


personally i think even if the market worked out this method, it would try to fade it, as the majority of people would be trading the other way and it would hurt the MM's even more..

it attempts to trap the highs and lows of particular weeks and fade them.

the majority of traders trade breakouts, and go long on the break of a high. i on the other hand usually (circumstances permitting) go short..

if the MMs were to repeatedly take the market higher after a breakout, they would probably lose out as the herd would profit at my expense..

i dont see that happening...???
 
the majority of traders trade breakouts, and go long on the break of a high. i on the other hand usually (circumstances permitting) go short..

Many of the large funds are value based and buy when they think something is cheap and sell when it is expensive. They are counter-trend in nature, It may be that with a great deal of cash going into hedge funds using value based strategies that it has become harder to make money like this.
 
Top