Fibonacci Retracement's

mike.

Senior member
Messages
2,101
Likes
709
Any advice how to apply these to my chart ?
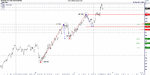
I'm trying to develop a strat from scratch as opposed to using someone else's, It involves drawing two trend lines, two S/R lines and fibs.
Now, what's the norm for applying fibs ? Should these be drawn between supp and res ? (This in fact wont give any fib levels should the price breakout) Any recommendations ?
 
The chart software I use automatically places them on highs and lows which seem less useful than opens and closes. So I coded my own indicator to do that. Others suggest using swing highs and lows. Seems open season on just about anything with regard to Fibs, so why not try applying the fib levels to your support and resistance levels and see if there’s a probabilistic edge? Can’t hurt to try.

One thing perhaps others can help me with – which daily data do you use to calculate your daily fib levels? I’ve ended up using the 17:00 EST as the EOD marker, but is that as valid/worse/better than any other time of day in a 24 hour market? There doesn’t seem to be any official technical consensus so wonder what the majority use.
 
Any advice how to apply these to my chart ?
Hi mike.
There's a bunch of articles about Fibs in the Articles section of T2W - of which this is possibly the best: Fibonacci Retracements on the Mini Dow If you don't trade the YM - don't be put off by the title - it's worth a read for anyone interested in Fibs.

Do please maintain the thread with your experiments with fibs - be they good or bad - so other members may help you and learn from your experiences.
Tim.
 
Thanks for replying gents, That is a sound article nick has wrote there Tim, I haven't read it all yet but will analyse it later tonight.
 
Read andycans old posts made back in the day when people used to discuss trading here. He lets a few cats out of bags.
 
Read andycans old posts made back in the day when people used to discuss trading here. He lets a few cats out of bags.
Thanks for the heads up, the hare.

I found this thread and duly made it a [Best Thread] - are there any others that you had in mind when you wrote your post?
Tim.
 
Thanks for the heads up, the hare.

I found this thread and duly made it a [Best Thread] - are there any others that you had in mind when you wrote your post?
Tim.

I wasn't really thinking a particular thread, just the general banter from the sacred geometry crowd.

I did a lot of work on fibs at one time, but never quite cracked it, mainly cos I was focussing on the predictive aspects rather than more important stuff. I have some very interesting charts back it be UK based on Elliot waves and fibs that are spookily accurate, I might post them one day 4 d lulz.

The problem I have with this stuff is there are too many lines, square based geometry, circle based, triangle based, fib levels, inverse of these levels etc. then there's discretion in selecting swing points, then there's timeframes etc, way too many degrees of freedom, but occassionally I can't help having another look.

I hate reccommending predictive techniques, but if people really must, then you might as well point them at the most intelligent bits of the intelligent nonsense :LOL:
 
I always found Fib levels to be uncannily accurate..in hindsight
like the Hare says, i have some historically amazing charts that can be shown to be spot on a fib level, but I'll be damned if you can ever really recreate it.
There are better/more reliable techniques for forecasting imho
 
I always found Fib levels to be uncannily accurate..in hindsight
like the Hare says, i have some historically amazing charts that can be shown to be spot on a fib level, but I'll be damned if you can ever really recreate it.
There are better/more reliable techniques for forecasting imho


This is where im struggling Malaguti, In order to develop a strat using say moving averages, macd, etc etc.. first you must understand the mechanics of them and how they work, its fair to say that i dont.

I have read a few books relating to TA but, Saying buy when the red line crosses the blue and vice versa is all well and good but you really need to understand the reasoning and mathematics behind it, Then again, how deep do you go into TA, Some say keep it simple :confused:
 
The chart software I use automatically places them on highs and lows which seem less useful than opens and closes. So I coded my own indicator to do that. Others suggest using swing highs and lows. Seems open season on just about anything with regard to Fibs, so why not try applying the fib levels to your support and resistance levels and see if there’s a probabilistic edge? Can’t hurt to try.

on my chart you add them manually, Ether drag them to open/close or high/low

Am i right in thinking that it should be 0% at the top and 100% at the bottom of the chart ? and is this the same in ether a up-trend and down-trend ?
 
This is where im struggling Malaguti, In order to develop a strat using say moving averages, macd, etc etc.. first you must understand the mechanics of them and how they work, its fair to say that i dont.

I have read a few books relating to TA but, Saying buy when the red line crosses the blue and vice versa is all well and good but you really need to understand the reasoning and mathematics behind it, Then again, how deep do you go into TA, Some say keep it simple :confused:

I know Mike, often I'm too quick to advise people against going down a route only because something doesn't work for me. let that not put you off, though.
It was said earlier but I would just restate if I were to look at Fibs, I would do so in conjunction with a nicely trending chart and never forget the definition of that trend being higher highs/lows etc. Each new higher low should be your starting point. You can apply fib to any sort of chart, so non time based ones also..good luck Mike.
 
All advice is greatly appreciated malaguti (y)

The position where i am at now is, ive been demo trading on the SB platforms for nearly a year now, With ever increasing workload i am getting less and less screen time, I have a live SB account where i will be cutting my teeth, mostly for the pure enjoyment of participating in the market's, I have the understanding that im going to witness the odd skewed chart and slippage but Ill only use money i can afford to loose, like a night at the casino if you will.

The problem im facing is getting a strategy put together, mainly entry points, My trading plan is to take a set number of pips as opposed to a exit point, I came up with the idea of using fib's on a short TF trending chart coupled with a set of bullish/ buy shaped candle formations or vice versa. As this is mainly for the enjoyment factor I shall be day trading only, closing all positions each night. Many will say Ill blow the account within a couple of weeks, but, with a bit of money management included it might just work out :LOL: what dya think.
 
The position where i am at now is, ive been demo trading on the SB platforms for nearly a year now, With ever increasing workload i am getting less and less screen time,
why not look for a strategy then that is more aligned to not having to use alot of screen time..however you say this is just for the enjoyment (really Mike? not to make any money?)and therefore if i proposed a different approach that might actually have some substance...

The problem im facing is getting a strategy put together, mainly entry points

thats not that difficult. i'll pm you a couple of pointers I started with, and then you can refine that if you wanted with fib levels which like I say I don't necessarily bother with. Just not needed for me, but doesn't mean you cant use it with the most basic of systems
 
..however you say this is just for the enjoyment (really Mike? not to make any money?)

Well whats the odds? really, Ill just be using a small stake, And if i did make a relatively constant profit and begin to understand the market's i would hope to progress on to mt4 with dma.

I like to participate as opposed to setting a EA and checking it every now and again. It would be interesting to know how many traders went directly to dma and are self taught without having to attend courses.
 
on my chart you add them manually, Ether drag them to open/close or high/low

Am i right in thinking that it should be 0% at the top and 100% at the bottom of the chart ? and is this the same in ether a up-trend and down-trend ?
Depends whether you’re looking to plot an extension or a retracement. On a down trend looking to plot an extension the 0 would be the peak and the 100 the trough. Which is why I coded my own. I just stick it on the chart at the levels I consider significant and it plots extension & retracement levels regardless of direction.
 
a chart of EXPN. there are two fib calculations you can see the retracement levels on the right, one in green and the second in red
Start from the low to the high (in an uptrend), this produces the fib retracement levels. nice how the first ends on the 38% exactly and the second on the 50% retracement exactly.
I read somewhere that you have to use High low, well the close chart ive drawn clearly demonstrates otherwise
 

Attachments

  • EXPERIAN.jpg
    EXPERIAN.jpg
    804.7 KB · Views: 199
in Ensign Software the is an utility called Pesavento Pattern.

It will identify and plot all the possible retracements and sometimes multiples retracements will appear on a single pivot point.

I have a problem believing you can trust them all the time BUT Bill McCready found a clever way to use them.

If you are in a position, and suddenly a pesavento pattern is printed on your chart you get the hell out.

If you are looking to enter the market and suddenly a pesavento pattern is printed on your chart, you start looking for clues in the price action, supp/res, and other indicators to decide what will be the next best possible entry.

The way I have seen people using it is by anticipation the market "should turn" sometimes it will work remarkably well but more often that not you're screwed.

SO this approach as a warning to get out and a warning to start looking for strong evidence to enter the market makes sense to me.
 
I love fibs, retracements and extensions.
I find the market often respects them and they can be used to pick places to potentially get in and are especially good for picking places to get out, or to trail a stop.
For example, if I was wanting to stay in a trend, and move my stop up, I would use fibs.

They are also good for getting a idea of how strong a trend may be, if there is a shallow retrace, this implies a strong trend, so if price can only go back to the 38fib it is likely we will see it be stronger.

The psychology behind this is pretty simple, if price can not retrace far, it is showing that people are eager to snap up the lower price (in a up trend - vice versa in a down trend) and this indicates investor sentiment is still strongly bullish (again, in a up trend)

I think it is better to use them from the 1h + charts (though they do work on smaller charts)


Some people do it from the extreme high/low (shadows) but I like to use them from the high/low close.
 
Love those ratios, especially when these form a zone of confluence, strong probability of support and resistance in that zone. For example, recent price action in USDJPY.
 

Attachments

  • $USDJPY (Weekly)  Week 6_2013 - Week 10_2014.jpg
    $USDJPY (Weekly) Week 6_2013 - Week 10_2014.jpg
    103 KB · Views: 165
  • $USDJPY (Daily)  16_12_2013 - 07_03_2014.jpg
    $USDJPY (Daily) 16_12_2013 - 07_03_2014.jpg
    109.2 KB · Views: 163
Top