You are using an out of date browser. It may not display this or other websites correctly.
You should upgrade or use an alternative browser.
You should upgrade or use an alternative browser.
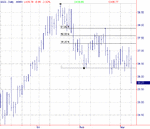
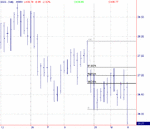
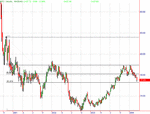
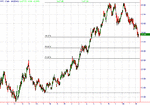
If you use them as a confirmation tool, they can be very useful. The trick is in picking the highs and lows from which to take a reference. I know of others that use them as a primary indicator. You need to look back over time and see how they fit a particular stock, so that you get a feel for how they can/can't provide assistance in making trading decisions.
CM, can you apply fibs to indices ( iv'e never used them myself ), it's just that indices ( Nas100 ) would probably be my preferred vehicle? Personally i would have thought that you could apply any form of TA to any style of trading although some kinds of TA may be more efficient depending upon the time scales invovled. PeeDee.
FTSE Beater
Experienced member
- Messages
- 1,518
- Likes
- 6
Hi Peedee
QQQ is the tracking stock for the Nas index
HTH 🙂
QQQ is the tracking stock for the Nas index
HTH 🙂
FTSE Beater
Experienced member
- Messages
- 1,518
- Likes
- 6
Hi Osho
eek 😱
I was afraid someone would ask that 😱
The only thing I really know about it is that it follows the Nasdaq very closely, and you trade it in the normal share dealing way. The main advantage is that you can trade the equivalent of 1/8th per contract size. 800 shares in QQQ would return roughly the same as 1 futures contract, so you could buy 100 shares and only have the equivalent of 1/8th of a futures position - If that makes sense.
I'm not sure if there is an option attached to it.
I pretty sure that's how it works, but it would be great if someone could confirm it 🙂
neil
Legendary member
- Messages
- 5,169
- Likes
- 754
Here is a link to some threads on QQQ's:
http://www.elitetrader.com/vb/searc...by=lastpost&sortorder=descending&pagenumber=3
http://www.bettertrades.com/BTC/Tutorials/20030724_Darlene.asp
http://www.democraticunderground.com/forum_archive_html/DCForumID27/1244.html
http://www.nasdaq.com/indexshares/nasdaq100_intro.stm
http://quotes.nasdaq.com/asp/investmentproducts.asp
Hope this helps 😀
Last edited:
Similar threads
- Replies
- 4
- Views
- 2K

