Favorite chart setup?

des44

Well-known member
Messages
281
Likes
8
Everyone has their favorite type of chart set up to play. You know, the type of set up that gives you the "warm fuzzies" and makes you need to pee when you see it.

Personally I am curious to what your favorite chart scenario is. If possible add a pic of a chart for us to review. This should be fun. :cheesy:

d-
 
In view of the fact that you have stated elsewhere that you make at least $10K a month maybe you would like to start the ball rolling by posting your own favouroite first ?


Paul
 
Fair enough

Fair enough,

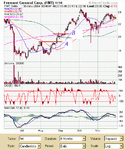
My favorite (long) setup would probably be a breakout one. The one that really does it for me are those stocks that create a base on a swing-high. Meaning the stock price goes up but it never comes back down for a swing-low (such as bouncing off the 20dma). But instead the stock price bases (consolidates/goes sideways) for a number of days. These stocks (if already in an up-trend) have a high probability of breaking out. The best base, IMHO, is that of an ascending triangle. This means the highs of the base stay around the same price level, but the lows of the base are getting higher and higher each day. Now this is power. Stocks hate to be pinched and this is showing that the bulls are in control.

I then set, what I call a "trap" (a stop order to buy). My trap is carefully set above the highest price that the base had made. If this thing pops I want in. If the base collapses then my order never fills and I am looking for others.

Because I am fairly new at capturing image shots of charts, I do NOT yet have a good collection of chart examples. The below chart is my first attempt of posting an image and is sux as an example of what I mean, but I am done for today searching for charts that really show what I am talking about.

A = Nice little break out starting the beginnings of an up-trend.
B = Stock too strong to pullback and creates a base. The 200mda acts as resistance. I set my trap above the highs of the base. If it pops we all make some money. If it tanks we don't lose a dime.

d- *my chart example sux*
 

Attachments

  • FMT2.GIF
    FMT2.GIF
    18.5 KB · Views: 627
Last edited:
Cool! It worked. ( I am such a noob).

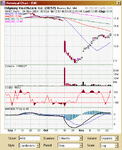
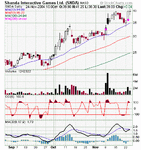
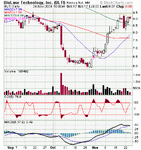
Anyway, now that I am officially excited about posting charts here are a couple of my (successful) trades that I am in right now. And YES, I have expense trades also.

ODSY = Normally I do not go long on stocks below the 50dma (bad things happen under it). But this stock was too tempting to not play. I loved it smooth pullback after it tanked. Still holding this one. Bot at pink dot, which is just above the previous day's high. Already up over 80%. Yippy!

SNDA = This ones I entered twice (pink dots). The first pink dot was a bit risky due to the resistance level. The second buy-in point was exciting to me due to the nice hammer candle stick it showed me when it pulled back to the 20dma. Still holding this one also. Have stop just under $40.

BLTI = This one I entered due to it breaking resistance level but was leary of it. I watched it closely so it didn't get away from me. Still holding it (with smart stop positioning) for very nice profits.

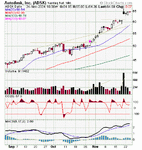
ADSK = This one just keeps going. It's like the Energizer Bunny (umm.. you UK guys may not get the joke). Look at the base it created just above $60. This is a base on a swing high that I like so much. It broke out. Anyway, it's a stock that I am still holding. How fun.
 

Attachments

  • ODSY.gif
    ODSY.gif
    22.5 KB · Views: 401
  • SNDA.gif
    SNDA.gif
    17.2 KB · Views: 439
  • BLTI.gif
    BLTI.gif
    17.3 KB · Views: 429
  • ADSK.gif
    ADSK.gif
    17.2 KB · Views: 441
Some interesting trades des44, do you mainly use charts with 1-day bars or also intraday charts?
 
Last edited:
Hey Nagula,

From my experience charts for intra-day, daily, and weekly all seem to have the same tendencies. After all charts are simply a visual representation of people's emotions.

However, I do little intra-day trading due to the fact I don't have to. There's no doubt that I am missing out on a butt-load of $$$, but I mainly trade long & short daily charts. I like my free time throughout the day to make sure my baby daughter is entertained and that my businesses are flowing nicely.

When I'm a "good boy" I'll check the weekly charts against my daily charts to confirm a better entry.

d-
 
One simple indicator scenario that I like is when the instrument I am trading becomes overbought (moves above 75-80) or oversold (moves below 25-20) on the RSI14 scale. The reason I like this is because there is a high probability of a decent sized retracement, thus presenting a high probability trade entry. Simple but effective....................


Cheers
jtrader.
 
des44,

Well done on good examples of trades you have taken. Do you trade just Nasdaq stocks and do you position your size differently or do you use the same size for each trade taken ?


Paul
 
jtrader,

Nice input on the Relative Strength Indicator (RSI). This past year I did a (small) study on the RSI. What I was trying to see is whether or not one could position trade a stock by using that indicator alone. My idea was to measure any profits that one might gain by buying the stock when the RSI line broke the 50 center line. You would then sell the stock once it crossed down below the 50 center line. My conclusion was the price was almost break-even in regards to profit vs. loss and did NOT serve as a reliable investing strategy.

The MACD is something that I use to help bring weight to prospective stocks that I am considering. It doesn't hold much weight in regards to an exit strategy, IMO.

d-
 
Thanks, Trader333 (Paul).

Wow, I didn't even realize that all I showed was Nasdaq positions. I trade the NYSE also; having no real bias towards one over the other.

In regards to position size, I normally use the same size, but will sometimes load up on those stocks that give me the warm-fuzzies on the inside. ;)

d-
 
I have several setups that I like and it very much depends on the type of trading day we are having (I trade intra-day only at present but I am developing a position trading stategy as well).

If we are having a trending day (say upwards), then I will look to trade 52 week high breakouts but this is a somewhat more complex setup than the name suggests. The reason for this is that when I get alerted to this type of trade it will also have to be confirmed by a particular volume pattern and finally the level II screen will also have to exhibit particular characteristics for me to determine the optimum entry price.

It would be a little difficult for me to post exactly what I mean by this but I have posted many of my live trades on these boards in the past including charts and explanations. The 52 week high / low breakout has been a good earner for me with very low risk levels.


Paul
 
jtrader,

Nice input on the Relative Strength Indicator (RSI). This past year I did a (small) study on the RSI. What I was trying to see is whether or not one could position trade a stock by using that indicator alone. My idea was to measure any profits that one might gain by buying the stock when the RSI line broke the 50 center line. You would then sell the stock once it crossed down below the 50 center line. My conclusion was the price was almost break-even in regards to profit vs. loss and did NOT serve as a reliable investing strategy.

The MACD is something that I use to help bring weight to prospective stocks that I am considering. It doesn't hold much weight in regards to an exit strategy, IMO.

d-

Hi des44

With the RSI - on a scale of 1-100, 30 = oversold and 70 = overbought. 50 is bang in the middle on the overbought-oversold scale...................
I would expect results to be better than your 50 and 50 scenario - if you adopted a strategy along the lines of - buy when the value moves up above 25-30 and sell when the value moves back below 75-70. RSI sometimes goes below 20, to around 15 - but it then often retraces significantly - no matter what the long term trend. The lower or higher the RSI value goes, the higher the likelihood of an imminent retracement.

The danger of buying above RSI value 25-30 and not selling until it passes below 75-70 is that the price may be trending downwards. Therefore this strategy is not perfect and is ideally suited to a ranging market. Therefore a stop-loss strategy does need to be incorporated in order to protect against the possibility that the RSI value and the price will not rise, but keep on sliding down.

Cheers

jtrader.
 
Man, I thought this would be a very interesting post of people's favorite chart setups. Hmmm. Timid I guess.

d-
 
yeh with that rsi it sometimes goes down , but then it goes up and back down , or occassionally down then back up!!!
 
Breakout of Ranges

You know the situation, a stock is trending in a particular direction or if it has rallied strongly for a few bars then consolidates for a while in a tight range.

I will normally mark the high and low of the trading range and often buy whist still in the range e.g.. if I expect a breakout to the upside, I will buy when the price is near the low with a stop a few cents below the low of the lowest bar in the range.

My risk is pretty low as I have bought near the extreme away from the break out and thus my stop is pretty close. Even if I don't get the break out, I can usually make a few cents on the trade - better than a few cents loss.

I trade intraday mainly.
 
ardhill,

Very nice post. Thanks for sharing.

It sounds like we might favor the same kind of trade. The only difference is that a prefer to buy after the price has broke the high of the "range". I hate "waiting" (sometimes for some time) for something to move but rather prefer to have a trap (stop) positioned to ride the breakout when (if) it happens.

Best of luck to you.

d-
 
Yep

Looking at some of your charts there are similarities in out styles.

One thing that may be different though, you appear to be a little more profitable than me though :)

But hey, I know what a number of my problems are and am working hard on putting them to death.
 
Top