eur system tested longs

Eur system going well

ChowClown said:
Hi Slomo,

Not yet unfortunately. I'll be testing it from next week, all being well. Nice signal on Monday ;-)

Hi ChowClown,

Did you ever test this system I posted?
I've been using it and going well, see attachec pic

cheers
 

Attachments

  • FXsys2.JPG
    FXsys2.JPG
    37.6 KB · Views: 283
Plain english

Slomo7777

Can you just clarify the stochastic element for me?:D
I am trying to code this in tradestation language and I have slow and fast stochastics (d and k varieties) but I am unsure in your language what the signal line and the main line mean? My understanding is that fastd is the signal line and slowd the main indicatorline?

Thanks
Russell

slomo7777 said:
In Simple English

(A) : iSAR(0.008,11,0) is Parabolic SAR Indicator 0.008 STEP, 11 Maximum
(B) : iSAR(0.005,11,0) is Parabolic SAR Indicator 0.005 STEP, 11 Maximum
(C) : (iMA(27,MODE_LWMA,0) is Linear Weighted Moving Average of 27 on Closing price
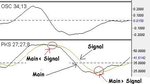
(D) : (iSTO(27,8,27,MODE_SMA,MODE_MAIN,0) is Stochastic Oscillator Indicator, %K = 27, %D = 8, Slowing = 27, on Simple Moving Average, Main Indicator line Line)
(E) : iSTO(27,8,27,MODE_SMA,MODE_SIGNAL,0) is Stochastic Oscillator Indicator, %K = 27, %D = 8, Slowing = 27, on Simple Moving Average, Signal Indicator line Line)
==========================================
Therefore IF No trade is open then

IF A<C AND B< C AND D>E AND D>35 AND D<45
then Open a Long Trade TP 57, SL 126
Slomo

===================================

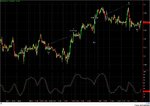
HAVE A LOOK AT ATTACHED PIC

If TotalTrades < 1 then
(

//EUR%
If (iSAR(0.008,11,0) < iMA(27,MODE_LWMA,0) ) and
(iSAR(0.005,11,0) < iMA(27,MODE_LWMA,0) ) and
(iSTO(27,8,27,MODE_SMA,MODE_MAIN,0) > iSTO(27,8,27,MODE_SMA,MODE_SIGNAL,0))and
(iSTO(27,8,27,MODE_SMA,MODE_MAIN,0)> 35) and (iSTO(27,8,27,MODE_SMA,MODE_MAIN,0)< 45)

then
//sl126 profit 57 pips
SetOrder(OP_BUY,1,Ask,3,Ask-126*Point,Ask+57*Point,HotPink);
exit;
)
 
Last edited:
Use the slow stochastic tool, in your graph you will have two lines, the signal always follows the main line. What this comment below says is that the main line turns at the bottom first, and crosses (is greater than) the signal line which is lagging it

(iSTO(27,8,27,MODE_SMA,MODE_MAIN,0) > iSTO(27,8,27,MODE_SMA,MODE_SIGNAL,0))
 
Hi slomo,

Apologies for not replying sooner. I haven't had an opportunity to test yet. Following your progress with interest though ;)

Good luck.
 
So its a buy when %k rises above %d?
Traditional in other words?

slomo7777 said:
Use the slow stochastic tool, in your graph you will have two lines, the signal always follows the main line. What this comment below says is that the main line turns at the bottom first, and crosses (is greater than) the signal line which is lagging it

(iSTO(27,8,27,MODE_SMA,MODE_MAIN,0) > iSTO(27,8,27,MODE_SMA,MODE_SIGNAL,0))
 
Right I think I have that
Attach pic - do the signals match?
 

Attachments

  • slomo euro strat.jpg
    slomo euro strat.jpg
    144.4 KB · Views: 240
Top