Now before I get eaten alive I have to stress I have no idea how this performs in a sideways market.
The basic premise is to work with the trend for trade entry and to have a clearly defined stoploss criteria.
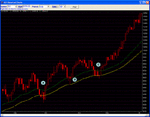
The attached image illustrates the idea.
A daily chart chart is used and it is the end of day values which are key. The chart has a 34 EMA and a 55 EMA.
If the 34 is above the 55 we are looking for long entries.
If the 34 is below the 55 we are looking for short entries.
If there is little divergence between the EMA's (they are very close to each other) then do not use the system until the dominant trend is clearly identified.
Always wait for a pullback into the zone between the EMA's.
Go long when the 34 EMA is above the 55 EMA and the candle completes the day above the 34 EMA. If the previous down candles had penetrated the 55 EMA then a long entry can be considered at a close above the 55 EMA.
Go short when the 34 EMA is below the 55 EMA and the candle completes the day below the 34 EMA. If the previous up candles had penetrated the 55 EMA then a short entry can be considered at a close below the 55 EMA.
Initial stops are at the 34 EMA (or 55 EMA if used for initial entry).
For the chart shown lets look at the marked points.
Point A
Pretty straightforward. The 34 EMA is above the 55 EMA so looking to go long. The down move had penetrated both the 34 and 55 so we could enter on the first close above the 55. If we had taken this entry we would have been stopped out when the actual crossed back through the 55. The following day it completed above the 34. We now go long with a stop at the 34 EMA level. Run the trade with a trailing stop as usual.
Point B
Again straightforward. The 34 EMA is above the 55 EMA so looking to go long. The down move had penetrated the 34 EMA and so we would enter on the first close above the 34. The day following entry we would have stopped out on the intraday move back below the 34 EMA. The following day it completed above the 34. We now go long with a stop at the 34 EMA level. Run the trade with a trailing stop as usual.
Point C
A little messy but it still holds together. The 34 EMA is above the 55 EMA so looking to go long. The down move had penetrated the 34 EMA and so we would enter on the first close above the 34 EMA. It does not close above the 34 but continues down through the 55 EMA. It then completes above the 34 EMA and triggers our long entry. We now go long with a stop at the 34 EMA level. Run the trade with a trailing stop as usual.
I have used the Dow to illustrate this but it seems to work across a wide range of instruments. Those trading Forex might find it interesting as Forex does seem to have lengthy trending periods.
Comments and criticism welcomed.
PS. if you make money using it then there will of course be a backdated fee of champagne for life for yourself.
The basic premise is to work with the trend for trade entry and to have a clearly defined stoploss criteria.
The attached image illustrates the idea.
A daily chart chart is used and it is the end of day values which are key. The chart has a 34 EMA and a 55 EMA.
If the 34 is above the 55 we are looking for long entries.
If the 34 is below the 55 we are looking for short entries.
If there is little divergence between the EMA's (they are very close to each other) then do not use the system until the dominant trend is clearly identified.
Always wait for a pullback into the zone between the EMA's.
Go long when the 34 EMA is above the 55 EMA and the candle completes the day above the 34 EMA. If the previous down candles had penetrated the 55 EMA then a long entry can be considered at a close above the 55 EMA.
Go short when the 34 EMA is below the 55 EMA and the candle completes the day below the 34 EMA. If the previous up candles had penetrated the 55 EMA then a short entry can be considered at a close below the 55 EMA.
Initial stops are at the 34 EMA (or 55 EMA if used for initial entry).
For the chart shown lets look at the marked points.
Point A
Pretty straightforward. The 34 EMA is above the 55 EMA so looking to go long. The down move had penetrated both the 34 and 55 so we could enter on the first close above the 55. If we had taken this entry we would have been stopped out when the actual crossed back through the 55. The following day it completed above the 34. We now go long with a stop at the 34 EMA level. Run the trade with a trailing stop as usual.
Point B
Again straightforward. The 34 EMA is above the 55 EMA so looking to go long. The down move had penetrated the 34 EMA and so we would enter on the first close above the 34. The day following entry we would have stopped out on the intraday move back below the 34 EMA. The following day it completed above the 34. We now go long with a stop at the 34 EMA level. Run the trade with a trailing stop as usual.
Point C
A little messy but it still holds together. The 34 EMA is above the 55 EMA so looking to go long. The down move had penetrated the 34 EMA and so we would enter on the first close above the 34 EMA. It does not close above the 34 but continues down through the 55 EMA. It then completes above the 34 EMA and triggers our long entry. We now go long with a stop at the 34 EMA level. Run the trade with a trailing stop as usual.
I have used the Dow to illustrate this but it seems to work across a wide range of instruments. Those trading Forex might find it interesting as Forex does seem to have lengthy trending periods.
Comments and criticism welcomed.
PS. if you make money using it then there will of course be a backdated fee of champagne for life for yourself.
Attachments
Last edited: