Best Thread :|Entry=Risk Exit=Reward|:

Status
Not open for further replies.
just tidying up the thread. posts made here:

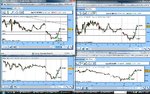
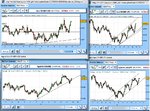
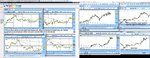
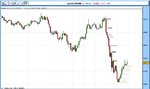
4:56- EJ now, was scalping range 13347 to upternd. breaking uptrend. previous rejection breaks this could be good (13309)

5:01 - ounced! patience to see what happens now

edit 37 minor level
edit here comes 47

5:10 - looks like uptrend continues. not in anything anymore but successful RbS on 13309.

feels like a friday

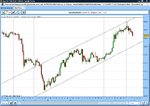
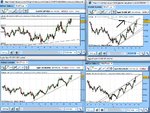
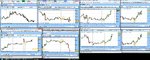
5:17 - sucessful bounce on 37... too easy jesus christ

Right now:

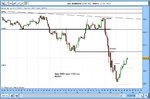
Bounced on previous broken uptrend which has touches on 3:20am 26th/ 6:35am 26th / 10:05am (ish) 26th.

no real momentum anymore. i'm outta here.

real trading starts again monday. hopefully do some hourly charts.

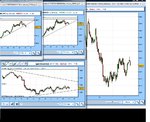
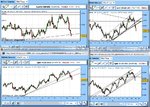
5:38 - 37 AGAIN ARGGGGGGH

5:58 - 2nd test of 09. this time to the exact pip. (bounce included).

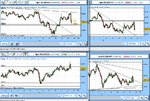
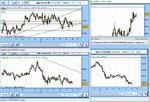
6:04 - cable looked totally unsupported but i wanted eurjpy to stay up, in turn eurusd to stay up. thought the safiest move was to buy eurgbp. worked out ok. 10pips isnothing but it all adds up. now check out the 2nd test rejection on eurjpy...

6:11 - 47 bounce again poss long 37 area, lets geez a shot i guess

6:17 - out at 45ish, didnt really get enough oomph to get through. it's basically a scratch. I really better go now.

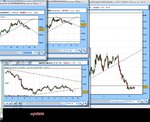
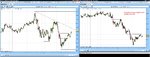
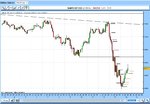
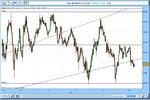
6:35 - added a chart, time for booze. lets hope uptrend holds.
6:36 - 1m chart added ALTHOUGH I DONT USE THESE.
6:38 - ignore the bottom uptrend line, affter that broke it was pretty invalid.
 

Attachments

  • thought you might appreciate a chart.jpg
    thought you might appreciate a chart.jpg
    147.8 KB · Views: 338
  • you can see bounces clearer.jpg
    you can see bounces clearer.jpg
    109.1 KB · Views: 345
Last edited:
Did some quick trades into the gap. Fortunately I was on just after the bounces - usually fx pairs start to trade away from the gap finds a s/r then trades right into it.

I was quite hoping this was going to range into the london open, but it obviously didn't - this is why I cut some of my trade.

Unfortunately instead of cutting the usual half I cut 80%! So i missed out on double what was on offer.

Anyhoo, basically, went long at cable then again off the support. Stuck stoplosses to breakeven.

I trailed my stops on all the pairs from the close of the previous candle. Now obviously if the previous candle is 5pips wide or just at support when your long you need some discretion to it. For example look at cable - 14182, traded through it - now if i stuck a stoploss at 14181 then it wouldn't get the chance to test the new found support it would just knock me out and keep going.

Anyways here are pics:

green = long
lines = sl
blue = take profit
purple = taken 80% profit :(

could have taken profit far later and if i did trail stops at end of candles after it broke my resistance lines it would have kept me in 100% but oh well. I'm tired. Only reason I've cut these and not stuck my stoploss to b/e is because I knew there was resistance here and i'm tired and wanting to get ready for the london session. Anyways that's 50 full pips from the 80% and 60ish from the 20%. If I kept full that would have been over 310 i think. Can't really be arsed counting these notes.

Good luck in the morning and catch you at 6ish I guess.

edit:just checking after making my chart and this post i wish i shorted my exits...anyhoo cant get them all (i did this while in my bed btw hahaha).
 

Attachments

  • tradestonight.jpg
    tradestonight.jpg
    236.2 KB · Views: 339
Last edited:
I wanted to do something special or big for my 100th journal post. Perhaps i'll do something sunday night or during next week. Just wanted to post up this beautiful channel, needs more touches mind you.
 

Attachments

  • 4chan.jpg
    4chan.jpg
    131 KB · Views: 340
Hey everybody!

Just noting some things to remember during the week:

ALL IN GMT

Tuesday:
Irish emergency budget!
tues.jpg

Wednesday:
wed.jpg

UPTICK RULE! US commision could reinstate the uptick rule which would stop aggressive shortselling.

Thursday:
thurs.jpg

Friday:
BANK HOLIDAY! USA, UK, ITALY, GERMANY MARKETS ALL CLOSED#

Most info can be obtained on ydays FT or their website, look for "market new this week" (havent been on their website to find it myself) or fxstreet.com / forex factory.

Good trading.

Uptick rule should be interesting, what do you guys think this will make the markets do...
 
yens = brilliant

cable = range = brilliant for scalping.
 

Attachments

  • ha fakesouts.jpg
    ha fakesouts.jpg
    191.3 KB · Views: 302
I ****ING LOVE RANGES

check out this sbr, and if you want to see an overnight play check out eurousd this morning. ****ing good stuff.
 

Attachments

  • vdfjklvb gv ,dfjhbvsejk fksdrbnvsd.jpg
    vdfjklvb gv ,dfjhbvsejk fksdrbnvsd.jpg
    256.2 KB · Views: 306
Well, I scalped myway to my target last night, meaning I left some running positions on EJ and GJ.

Woke up at the perfect time to cut them, I won't have to work tomorrow or the next day but I'm going to see what I can pull off.

Right now cable hourly looks nice for a short if not a little obvious for one.
 

Attachments

  • perfect wakeup call.jpg
    perfect wakeup call.jpg
    392.2 KB · Views: 273
posted on potential setups last night, i dont think anyone took it though. ha.

as typing euro = 13377 cable 14846 gj 14863 ej = 13392
 

Attachments

  • aspostedflastnight.jpg
    aspostedflastnight.jpg
    396.6 KB · Views: 330
Wow all the journals have lit up since today has more players. Bloody slackers IMO :p.

Anyways, quote from here:

Market will be very thin or closed on this day btw. Easter monday, I'm hoping that any yen pairs on friday and monday move then retrace it all on tuesday.

This has happened exactly as planned. Always remember this during low vol / holidays for yanks/brits/japs.

Have a good day and I'll see what anal ysis I can pick out my bottom.
 
Last edited:
OK:

Daily and Hourly charts of AUDUSD GBPUSD EURUSD and FTSE. More coming later with EURGBP GBPJPY EURJPY GBPCAD DOW and OIL (maybe more). First comes football...

Beige = Area of S/R
Grey = Immediate S/R
Black = S/R
Orange = Support
Purple = Resistance
Red = Breakout

I'll do a quick annotation on each chart, please double click it for full view!

FTSE 100:
ftsedailyhourly14th.jpg

FTSE is rapidly approaching immediate S on the daily charts, if this breaks it signals a test of the 3700 area. First comes 3750 on the hourly.

GBPUSD:
cabledailyhourly14th.jpg

As typing I was going to write "cable has hit resistance and on hourly it should go down". Well that move has now happened and it has found more support. Once it breaks this range either 150 will come or 148...
Daily indicates a solid push up and I would not be surprised if 150 poped and it reached the upper channel or the next area of R.

EURUSD:
eurodailyhourly14th.jpg

Bloody mess, I'm waiting for a break of that flag on daily. Until then scalping FTW.

AUDUSD:
dailyhourlyaudusd14th.jpg

As on potential setups, this could pop. One more resistance then skies the limit. However, I'm looking on 1h and 4h for reversal signs as on daily they usually extend their limits. If I find one I'll take it and look to see if it can break this uptrend. Hourly is stuck in a range.

Hope you find this interesting or useful. Now I challenge you to download them or post your own daily and hourly analysis with spots I may have looked over or missed.

Good trading, cya after the game.
 
Cable came down and so did audusd :). Decided it's a lot easier to do this at the weekend. However I won't be able to do it this one! So next week ftw.

While I'm posting, cable is a mess hard to scalp with yesterdays pivots, R:R is hardly worth it half the time.
 
Little strategy for getting into breakouts or trailing.

If you see high momentum, get in stick a stop at the open of the 5m coloured candle. Only trail on the colour the momentum is going. In this case only red on the way down and only green on the way up.

You don't have to do colours, once it's broken through s/r you can just stick it past there (will annotate another chart in a bit). I'll update these by the end of 4pm to show you how they resulted.

In this case I went long at 05, but got out at 20-30 (not been a good day AT ALL), if I followed this strategy I would be up approx 70 pips
 

Attachments

  • right now.jpg
    right now.jpg
    93.1 KB · Views: 306
Trading on any candle and S/R.

Would like to backtest this actually. 2009 breakouts etc. Cable bouncey on 14521 earlier low :).
 

Attachments

  • any candle.jpg
    any candle.jpg
    67.3 KB · Views: 280
  • tradk.jpg
    tradk.jpg
    94.5 KB · Views: 293
Back to hourly charts for this journal, 5m entry, 1h holding, 5m exit.

Cable broke 14521 so stop would now be at 14510ish on the resistance method - will post more later.
 
Status
Not open for further replies.
Top