entry/exit points

Altern8

Junior member
Messages
33
Likes
0
Hi folks,

Is there any way to spot/chart/guess entry/exits on the dow? I have a habit of missing the entries points and getting out too soon or buying, thinking the market will go up, and its fell etc.

I have only been trading a short while, so far I have made a profit just over £300, which I am pretty pleased with. I am using Capital Spreads, which is a lot better then Tradindex, which I have also used. I trade the futures, like yesterday, I brought, when the market was high'ish, thinking it would go higher, but it fell, and I am sitting a paper loss of £69. :(

Yes, your right I am a newbie =)

Any help/hints/advice would be most welcome.

regards

Kev
 
Altern8,

The most important thing is to find out what works best for the type of trading that suits you. People use trendlines, moving averages, fibonnacci levels, level 2, support/resistance levels etc.

I find support/resistance levels on a weekly 15 minute chart most helpul for me, but YMMV. I can post an example if you want.

Pete.
 
Altern8,

There are so many indicators and entry/exit staregies out there and as many justifications to use them, that it all gets a tad confusing/frustrating knowing which ones to use. It's a case of trying out as many as you can (through the capitalspreads demo account for example) and seeing which one 'feels' right for you, before live trading.

I've tried many TA entry/exit indicators etc and I'm currently using an easy to use overbought/sold indicator, Williams%R(10) and volume analysis - I use www.marketvolume.com that provides an end of day summary, as well as longer term trend analysis.

I use these charts to assess short term overbought/sold conditions (1 & 5 Day charts) and a 1 month chart for the larger swings. Money management is the key to any system, I'm still working on the best stops to use on the DOW!

Good trading.
 

Attachments

  • wr10.html
    508 bytes · Views: 647
Last edited:
Hi folks,

Just wanted to say a BIG thankyou, I have got all the info that you guys posted etc, and will spend a couple of days, I guess over the weekend and go over it.

smileypete: Would you be able to post an example? I feel that it would be a great help to me. Thx

Cheers

Kev
 
Hi Altern8,

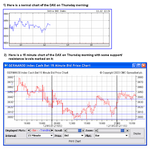
Here is an example of key levels on the DAX. I was going to post the first two charts on Thursday morning but didn't have time.

I try to identify not just highs and lows but also places where support becomes resistance and vica versa, as I find these key levels are often a good place to open and close trades.

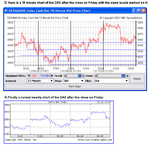
Most of the levels I'd marked on the chart on Thursday morning ceased to be relevant as the DAX moved up, but 3850 remained as a key level on Friday.

The final chart shows this quite clearly, although I find the 15 minute bar chart better for identifying some intra day levels that would not be clear on a weekly chart.

This is by no means the Holy Grail, but for _me_ I find it useful for trading the indices while the market is mostly rangebound.

However, if you're learning to trade it's best to find out not just what works, but what works for _you_.

Hope this helps,
Pete.
 

Attachments

  • charts1.png
    charts1.png
    38.3 KB · Views: 800
Smiley Pete

Those are great examples. I'm also a great believer in using two time frames and support/resistance.
 
Top