DionysusToast
Legendary member
- Messages
- 5,965
- Likes
- 1,501
All
I am currently looking to supplement my trading with the addition of some analysis to better help determine the day type on the ES.
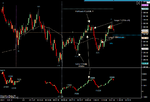
Generally speaking the ES is usually in a range for the day, although quite often this range is 10 points. To me, a range day could put in 2-3 good 'trends' and so when I talk about range days, I am not really talking about a choppy day with a small range. I am talking about a typical day that looks like this:

As you can see, this day ended where it started but it provided opportunity. A trend day of course will be one like Friday that looked like this:

Very clear right ? Of course it's very clear when you have the whole chart. I am a lot more succesful on range days that trend days and so I am now looking to see if I can supplement my analysis in order to better identify trend/range days early on. This journal is to record my observations with a view to deciding if I should bring in something else.
The method roughly speaking is.
1) Add levels of interest to a chart before the open (2 above the open & 2 below)
2) Look for developing levels during the day where there may be a reaction
3) Focus on DOM/T&S as we approach those levels
4) Stay away from news announcements unless a trade has breathing room
In terms of what I use now.
1) A review of the markets before the open to see what the key areas are around the open. This will vary depending on where we are - e.g. no point looking at yesterdays high if we have gapped over it already.
2) Tick chart with swing sizes marked out (up 3 points, down 2.5 points, up 4 points, down 2 points etc).
3) Cumulative delta
4) DOM /Time & sales
In terms of what I will be looking at to determine trend/range day
1) What I already use now - no reason to think what I use now won't give me what I need
2) VWAP (I have a ninja VWAP and need to investigate how accurate it is)
3) Sector/Industry analysis - I have a new screen up showing line charts for XLP, XLY, XLE, XLI, XLV, XLF, XLB, XLK, XLU, SOX, KBE. I will simply observe how the various sectors react in different day types. Theory is that if they all move in unison, we will probably trend.
4) 6E - just threw it up there to be honest but don't expect to get much from it.
I will probably also add NYSE TICK which may be useful for spotting trend days only. I think DOM/T&S will identify turning points much better than TICK but I am open to TICK being of use for trend day identification.
Comments are welcome.
I am currently looking to supplement my trading with the addition of some analysis to better help determine the day type on the ES.
Generally speaking the ES is usually in a range for the day, although quite often this range is 10 points. To me, a range day could put in 2-3 good 'trends' and so when I talk about range days, I am not really talking about a choppy day with a small range. I am talking about a typical day that looks like this:

As you can see, this day ended where it started but it provided opportunity. A trend day of course will be one like Friday that looked like this:

Very clear right ? Of course it's very clear when you have the whole chart. I am a lot more succesful on range days that trend days and so I am now looking to see if I can supplement my analysis in order to better identify trend/range days early on. This journal is to record my observations with a view to deciding if I should bring in something else.
The method roughly speaking is.
1) Add levels of interest to a chart before the open (2 above the open & 2 below)
2) Look for developing levels during the day where there may be a reaction
3) Focus on DOM/T&S as we approach those levels
4) Stay away from news announcements unless a trade has breathing room
In terms of what I use now.
1) A review of the markets before the open to see what the key areas are around the open. This will vary depending on where we are - e.g. no point looking at yesterdays high if we have gapped over it already.
2) Tick chart with swing sizes marked out (up 3 points, down 2.5 points, up 4 points, down 2 points etc).
3) Cumulative delta
4) DOM /Time & sales
In terms of what I will be looking at to determine trend/range day
1) What I already use now - no reason to think what I use now won't give me what I need
2) VWAP (I have a ninja VWAP and need to investigate how accurate it is)
3) Sector/Industry analysis - I have a new screen up showing line charts for XLP, XLY, XLE, XLI, XLV, XLF, XLB, XLK, XLU, SOX, KBE. I will simply observe how the various sectors react in different day types. Theory is that if they all move in unison, we will probably trend.
4) 6E - just threw it up there to be honest but don't expect to get much from it.
I will probably also add NYSE TICK which may be useful for spotting trend days only. I think DOM/T&S will identify turning points much better than TICK but I am open to TICK being of use for trend day identification.
Comments are welcome.


